Figures & data
Table 1. Characteristics of 32 patients with sinonasal inverted papilloma.
Table 2. Primer sequences used for quantitative real-time reverse transcription PCR.
A hierarchical cluster analysis was performed with 58 differentially expressed miRNAs as compared the SNIP tissues from the SNIP group (n = 5) with nontumorous tissues from the control group (n = 5; fold change >3; p < 0.01). Each row indicates one miRNA, and each column indicates one sample. The miRNA expression levels are illustrated using a color key and histogram. The red and green bars denote high and low expression, respectively.
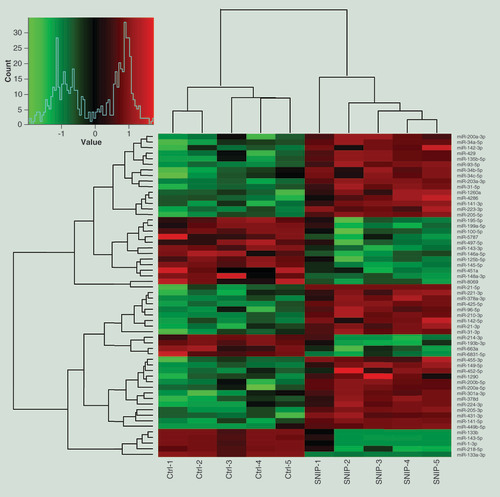
Table 3. List of differentially expressed miRNAs in sinonasal inverted papilloma tissues detected by miRNA microarray assay.
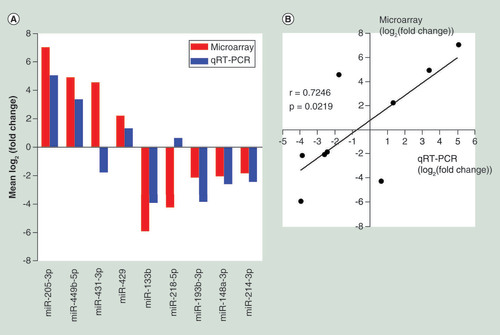
(A) Comparison of miRNA expression levels obtainedby miRNA microarray and qRT-PCR analysis. Upregulated and downregulated miRNAs are indicated by bars above and below the horizontal axis, respectively. (B) Pearson correlation analysis investigating the linear relationship between the microarray data and qRT-PCR results.
qRT-PCR: Quantitative real-time reverse transcription PCR.
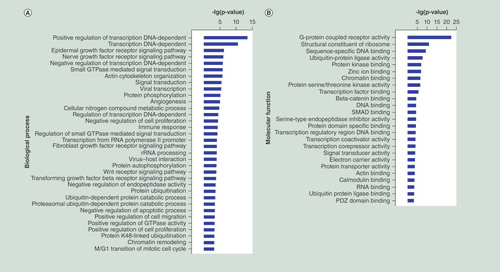
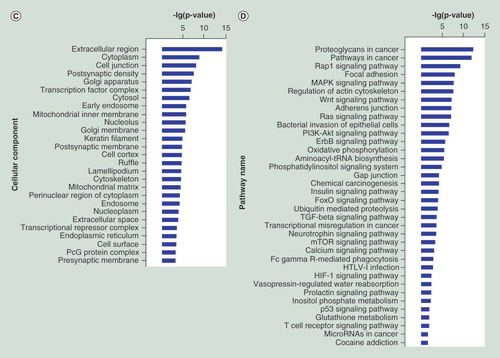
(A–C) GO functional enrichment of miRNA potential targets: (A) biological process, (B) molecular fuction, (C) cellular component. (D) Pathway annotation of the target genes of the miRNAs. Ordinate is the significant GO/pathway term (p < 0.05, FDR < 0.05).
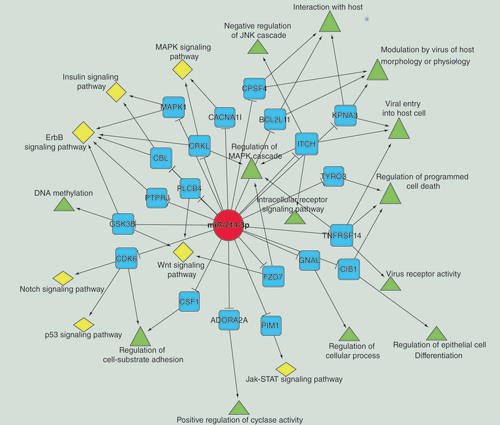
miR-214-3p is indicated by a red circle. Its target genes are indicated by blue squares. GO and pathway terms are represented by green triangles and yellow diamonds, respectively.