Figures & data
Table 1. Characteristics of fetal alcohol spectrum disorder patients and nonalcohol exposed controls.
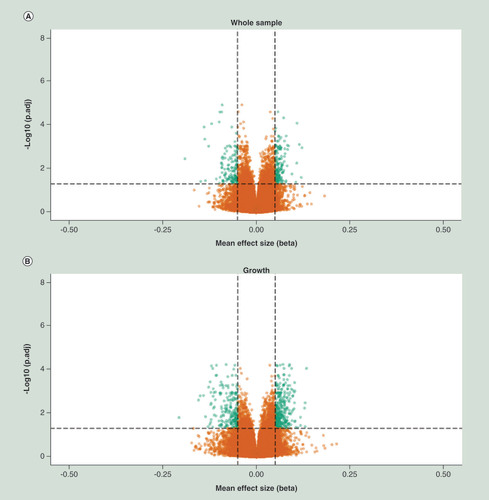
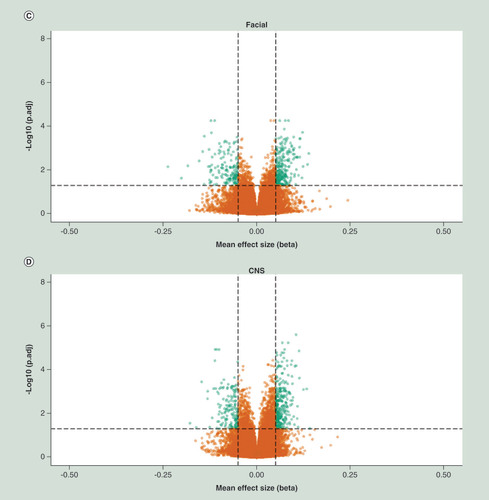
X-axis represent mean effect size difference between fetal alcohol spectrum disorder cases and controls, Y-axis represents the –log10 of the adj. P-value. Horizontal dotted line represents genome wide significance threshold, vertical dotted lines indicates an effect size (delta mean difference) of 5%. Green dots represents genome wide significant differentially methylated positions with an absolute effect size larger than 5%.
Relative percentage hypo (A) and hyper (B) methylation over the genomic features (TSS1500, TS200, 5’UTR, 1stExon, Body, 3’UTR and IGR) of the top 2000 DMP hits for each of the four analyses (whole sample, growth, CNS and facial FAS sub phenotypes) of the discovery cohort), relative to the total number of the feature in the analyzed dataset of 429.232 probes. Percentage hypo (C) and hyper (D) methylation over the genomic features (TSS1500, TS200, 5’UTR, 1stExon, Body, 3’UTR and IGR) of the top 2000 DMP hits for each of the four analyses (whole sample, growth, CNS and facial FAS sub phenotypes) of the replication cohort), relative to the total number of the feature in the analyzed dataset of 429.232 probes.
DMP: Differentially methylated position; FAS: Fetal alcohol syndrome; IGR: Intergenic region; TSS1500: Region 1500 bp upstream relative to the transcription start site of the annotated gene; TSS200: Region 200 bp upstream relative to the transcription start site of the annotated gene; UTR: Untranslated.
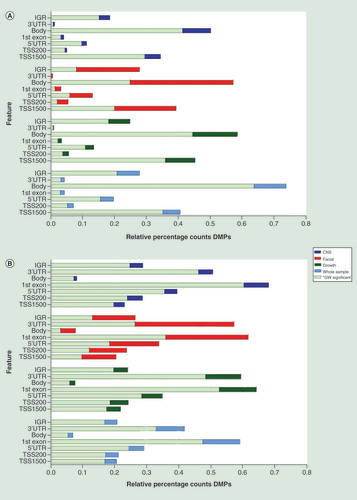
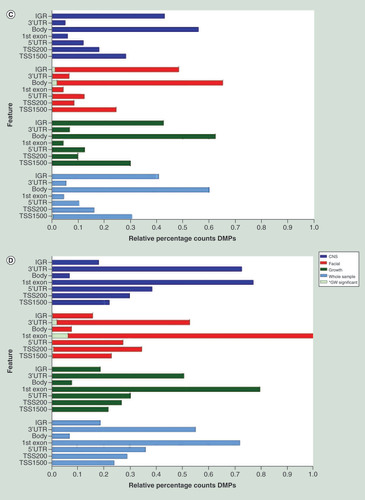
Table 2. Replication of genome wide significant differentially methylated positions detected in discovery cohort.
Table 3. Potential biomarker-replicated differential methylated regions associated in all fetal alcohol spectrum disorder groups.
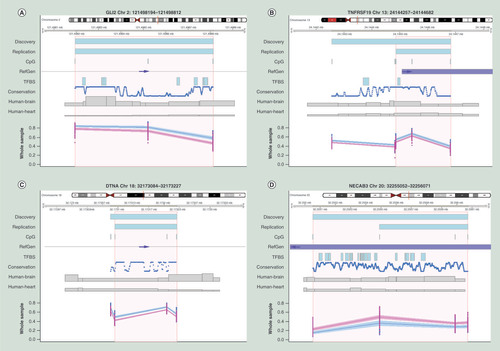
(A) Differentially methylated region (DMR) located in an upstream intergenic region of the GLI2 locus, (B) DMR located in an exon of the TNFRSF19 locus, (C) DMR located at an intronic intergenic region of the DNTA locus, (D) DMR located in an exon of the NECAB3 locus. All plots indicate the exact chromosomal position of DMRs detected in the discovery and replication cohort or the area (NECAB3) as reported by Portales-Casamar et al. respectively, annotated by the upper two blue bars. Area in orange represents exact position of the region of overlap between DMR detected in the discovery and replication cohort.
Blue and pink dots and lines represent fetal alcohol spectrum disorder (wholes sample only) patients and controls respectively, shading represents 95% CI. All chromosomal positions are based on hg19.
Conservation: Conservation of the sequence among 100 vertebrates (NCBI annotation); CpG: Location of known CpG sites; Human-Brain and Human-Heart: Brain and heart specificsummary of known active regulatory regions (e.g. enhancers), summarized as ‘Emerge’, as previously reported by van Duijvenbode et al. (2016); RefGen: Location of the reference gene (NCBI annotation) and the direction of transcription (blue arrows); TFBS: Summary of known transcription factor binding sites (NCBI annotation); X-axis: chromosomal position; Y-axis: methylation index expressed in beta-values.