Figures & data
Table 1. Clinical characteristics of patients with biochemical premature ovarian insufficiency and controls.
(A) Hierarchical clustering analysis of differently expressed circular RNAs (circRNAs; fold change ≥ 2, p < 0.05). Red = upregulated, green = downregulated. (B) Volcano plot visualizing the differentially expressed circRNAs. The red point in the plot represents the differentially expressed circRNAs (fold change ≥ 2, p < 0.05). (C) Scatter plot visualizing the differentially expressed circRNAs. The circRNAs above the top green line and below the bottom green line indicate more than twofold change of circRNAs.
circRNA: Circular RNA.
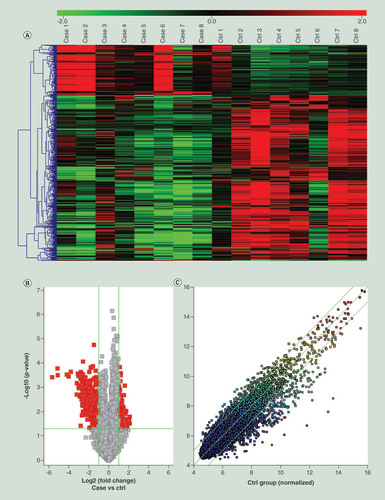
Table 2. Characterization of the top 20 upregulated/downregulated circular RNAs in patients with biochemical premature ovarian insufficiency.
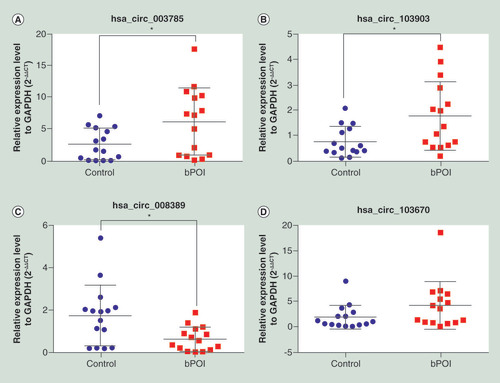
(A) has_circ_003785 (B) has_circ_103903 (C) has_circ_008389 (D) has_circ_103670. *p < 0.05.
bPOI: Biochemical premature ovarian insufficiency.
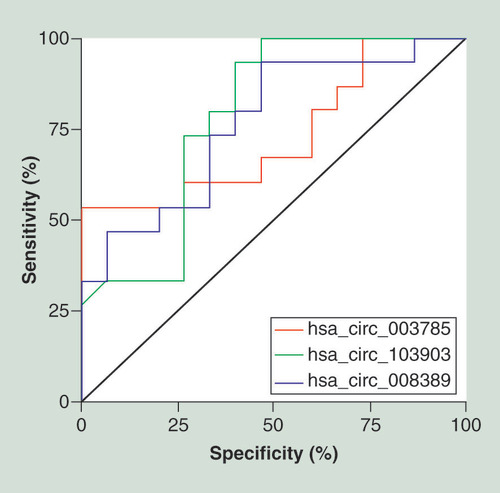
Receiver operating characteristic curve analysis of the expression levels of has_circ_003785 (red line), has_circ_103903 (green line) and has_circ_008389 (blue line) in biochemical premature ovarian insufficiency.
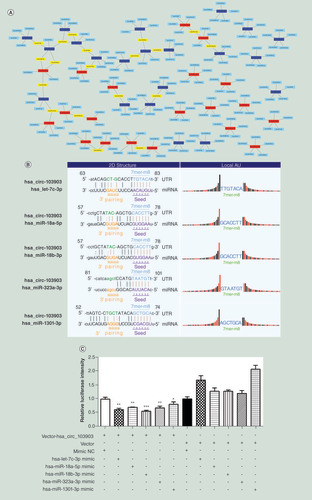
(A) The network comprising the top 20 upregulated (red nodes) and top 20 downregulated (deep blue nodes) circular RNAs and their target miRNAs (blue nodes) (miRNAs matched with more one circular RNAs are marked in yellow). (B) Binding sites of hsa-let-7c-3p, hsa-miR-18a-5p, hsa-miR-18b-3p, hsa-miR-323a-3p and hsa-miR-1301-3p in 3′UTR of has_circ_103903. (C) Hsa-let-7c-3p, hsa-miR-18a-5p, hsa-miR-18b-3p, hsa-miR-323a-3p and hsa-miR-1301-3p mimic or negative control oligonucleotide was co-transfected with pmiR-RB-Report vector with or without the 3′UTR sequence of has_circ_103903 to evaluate the effect of those miRNAs on the luciferase activities by luciferase reporter assay. *p < 0.05; **p < 0.01; ***p < 0.001.
circRNA: Circular RNA.
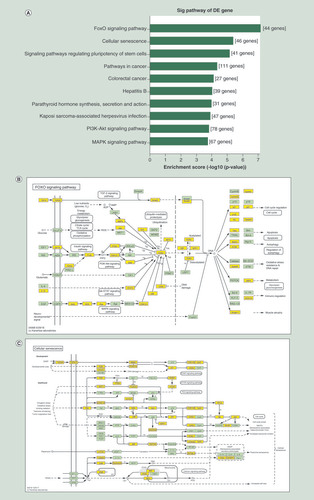
(A) KEGG pathway analysis for the top ten upregulated circRNA-targeted genes. The vertical axis shows the annotated functions of the target genes. The horizontal axis shows the enrichment score (-log10 transformed p-value). (B) Mapping of the FoxO signaling pathway. (C) Mapping of cellular senescence pathway. Yellow marked nodes are associated with differentially expressed circRNAs.
circRNA: Circular RNA; KEGG: Kyoto encyclopedia of gene and genome.