
Figures & data
Table 1. Summary characteristics of the study population by life course socioeconomic position.
Frequency of the 61 cis-eMS defining the inflammatory methylome by (A) inflammatory subpathway; (B) correlation between DNA methylation and gene expression; (C) physical distribution and (D) CpG island and neighborhood context.
eMS: Expression methylation site.
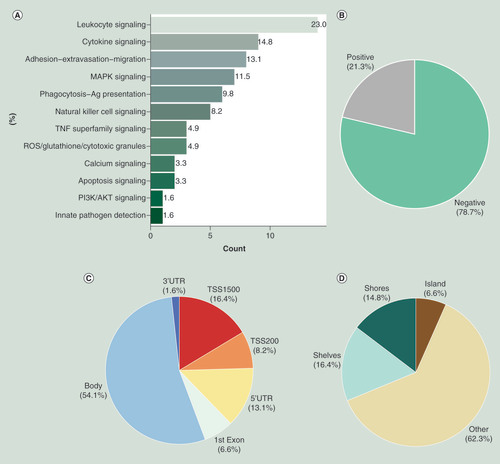
Table 2. Linear regression results for the inflammatory methylome and each of the three life course socioeconomic position factors in the European Prospective Investigation into Cancer and Nutrition-Italy participants from EnviroGenoMarkers (N = 155).
Table 3. Life course multiple regression analyses and the inflammatory methylome. Results are presented for the inflammatory methlyome score (A), the inflammatory methylome z-score (B) and the first PC (C). Estimates are based on 155 participants with complete socioeconomic position, lifestyle information and DNA methylation data.
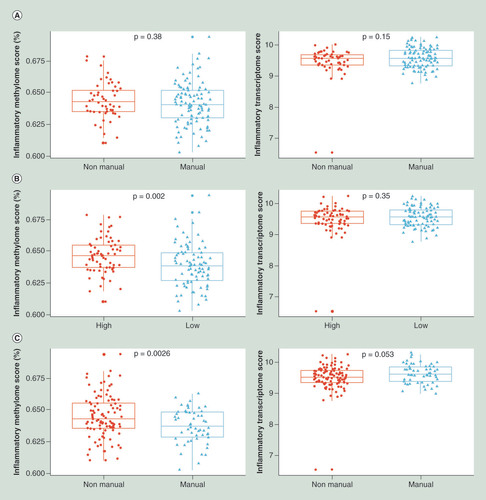
(A) Father’s occupational position; (B) participant’s education and (C) the highest household occupational position from 155 EPIC-Italy participants. t-test mean comparison p-values are reported for each score by SEP.
EPIC-Italy: European Prospective Investigation into Cancer and Nutrition-Italy; SEP: Socioeconomic position.
Supplemental material