Figures & data
Table 1. Clinical characteristics of first-degree relative and CTRL subjects.
Table 2. DMR distribution in first-degree relative subjects.
(A) DNMT3A mRNA expression was measured by qPCR in SVF from FDR (n = 9) and control (CTRL; n = 11) subjects. Data points represent AU from each individual subject. Mean values ± SD are also shown. *p<0.05 in a two-tailed Mann“Whitney U-test. (B) Representative immunoblot analysis of DNMT3A and β-ACTIN protein levels in SVF from FDR (n = 6) and control (CTRL; n = 6) subjects. Data are expressed as arbitrary units and shown as mean values ± SD. *p<0.05 in a two-tailed Mann-Whitney U-test. (C) Correlation between SVF DNMT3A mRNA levels and adipose cell size in FDR (n = 9) and CTRL (n = 11) subjects. r correlation coefficient and p-values are indicated on the graph.
AU: Absolute units; CTRL: Control; FDR: First-degree relatives; SD: Standard deviation; SVF: Stromal vascular fraction cells.
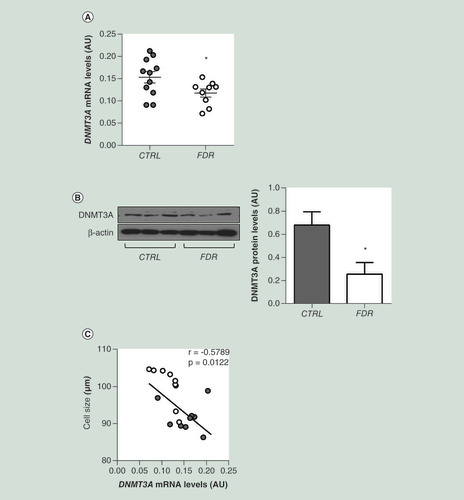
Table 3. List of the genes differentially methylated and expressed between first-degree relative and CTRL subjects.
Table 4. Characteristics of hypomethylated DMR associated with PTPRD in first-degree relative subjects.
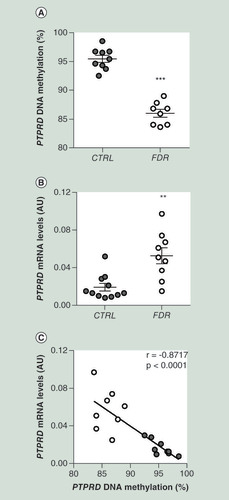
(A) BS analysis of PTPRD DMR in SVF from FDR (n = 8) and CTRL (n = 9) subjects available from the study group. Data points represent DNA methylation percentage at the PTPRD-associated DMR. Mean values ± SD are also shown. ***p<0.001 in a two-tailed Mann“Whitney U-test. (B)PTPRD mRNA expression was measured by qPCR in SVF from FDR (n = 9) and control (CTRL; n = 11) subjects. Data points represent AU from each individual subject. Mean values ± SD are also shown. **p<0.01 in a two-tailed Mann“Whitney U-test. (C) Correlation between PTPRD DNA methylation and PTPRD mRNA levels in SVF from FDR (n = 8) and CTRL (n = 9) subjects. r correlation coefficient and p-values are indicated on the graph.
AU: Absolute units; BS: Bisulphite sequencing; CTRL: Control; DMR: Differentially methylated region; FDR: First-degree relatives; SD: Standard deviation; SVF: Stromal vascular fraction cells.
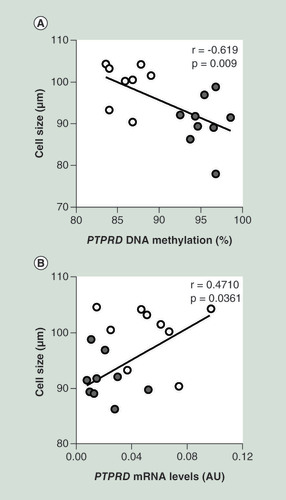
(A) Correlation between SVF PTPRD DNA methylation and adipose cell size in FDR (n = 8) and CTRL (n = 9) subjects. (B) Correlation between SVF PTPRD mRNA levels and adipose cell size in FDR (n = 9) and CTRL (n = 11) subjects. r correlation coefficient and p-values are indicated on the graph.
AU: Absolute units; CTRL: Control; FDR: First-degree relatives; SVF: Stromal vascular fraction cells.
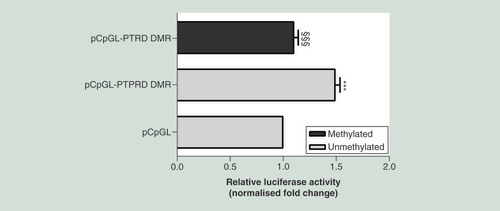
The 590 bp sequence corresponding to the intronic PTPRD-associated DMR chr9:10448607-10450000, was cloned into a pCpGL-promoter vector (pCpGL-PTPRD DMR), upstream the luciferase gene. The construct was either methylated by M.SssI (methylated pCpGL-PTPRD DMR) or mock-treated (unmethylated pCpGL-PTPRD DMR) and then transfected in ChubS7 cells. The data were normalized using a co-transfected renilla luciferase vector and are presented as fold change relative to the mock-treated empty vector (pCpGL). Data are shown as means ± SD of n = three independent experiments. Statistical significance was tested by one-way ANOVA followed by Tukey’s multi-comparison test: ***p<0.001 for comparison versus pCpGL; §§§p<0.001 for comparison versus unmethylated pCpGL-PTPRD DMR.
ANOVA: Analysis of variance;Â DMR: Differentially methylated region; SD: Standard deviation.
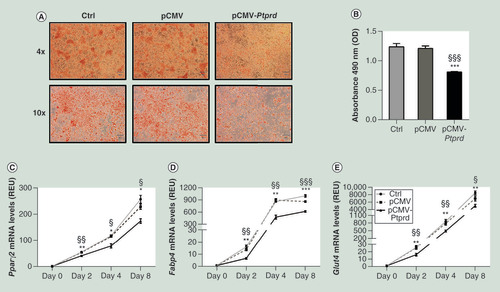
Un-transfected cells (Ctrl) and cells transfected with either the empty vector (pCMV) or the PTPRD expressing vector (pCMV-PTPRD), at differentiation day eight, were stained with Oil Red O and then subjected to phase contrast microscopy. Representative fields are shown in figure A. Lipid quantification (B) was assessed at 490 nm as described under Materials and methods. Expression levels of Pparγ2(C), Fabp4(D), and Glut4(E) were assessed by qPCR at the indicated time points. All data are presented as means ± SD of n = three independent experiments. Statistical significance was tested by one-way ANOVA followed by Tukey’s multi-comparison test at each indicated time point: *p<0.05; **p<0.01; ***p<0.001 for comparison versus Ctrl cells; §p<0.05, §§p<0.01, §§§p<0.001 for comparison versus pCMV transfected cells.
ANOVA: Analysis of variance;Â Ctrl: Control;Â OD: Optical density; pCMV: Cytomegalovirus promoter; qPCR: Quantitative PCR;Â REU: Relative expression units;Â SD: Standard deviation.
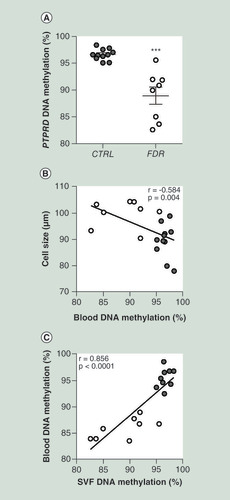
(A) BS analysis of PTPRD DMR in PBL from FDR (n = 8) and CTRL (n = 11) subjects available from the study group. Data points represent DNA methylation percentage at the PTPRD-associated DMR. Mean values ± SD are also shown. ***p<0.001 in a two-tailed Mann“Whitney U-test. Correlation between PBL PTPRD DNA methylation and adipose cell size in FDR (n = 8) and CTRL (n = 11) (B) or SVF PTPRD. DNA methylation in FDR (n = 8) and CTRL (n = 9) subjects (C)r correlation coefficient and p values are indicated on the graph.
BS: Bisulphite sequencing; CTRL: Control; DMR: Differentially methylated region; FDR: First-degree relatives; PBL: Peripheral blood leukocytes; SD: Standard deviation; SVF: Stromal vascular fraction cells.
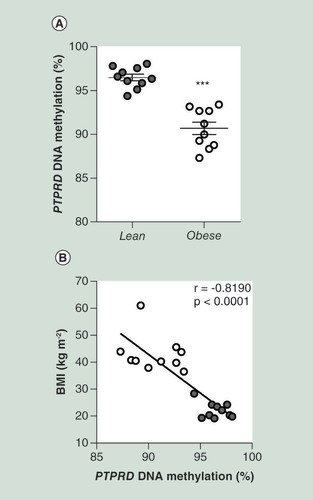
(A) BS analysis of PTPRD DMR in PBL from obese (n = 10) and lean (n = 10) subjects from the replication group. Data points represent DNA methylation percentage at the PTPRD-associated DMR. Mean values ± SD are also shown. ***p < 0.001 in a two-tailed Mann“Whitney U-test. (B) Correlation between PBL PTPRD DNA methylation and BMI in obese (n = 10) and lean (n = 10) subjects. r correlation coefficient and p-values are indicated on the graph.
BS: Bisulphite sequencing; DMR: Differentially methylated region; PBL: Peripheral blood leukocytes; SD: Standard deviation.