
Figures & data
Table 1. The clinicopathologic variables of patients with prostate cancer included in the study.
Table 2. The details of the six CpG sites in the prediction model.
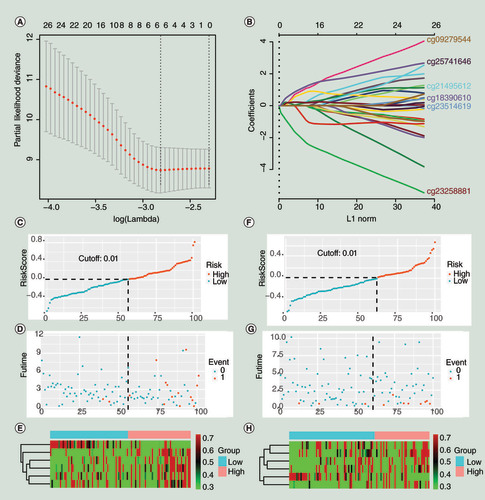
(A) The minimum misclassification error was obtained by cross-validation. (B) Based on the minimum of misclassification error, the inclusion sites and their coefficients of the model were obtained. (C–E). The training group. (F–H) The validation group. (C&F) The distribution of population risk scores and risk classification based on the cut-off value. The population was divided into high-risk and low-risk groups. (D & G) The relationship between the survival outcome of patients and the cut-off value. They indicated that the probability of poor prognosis would increase when the individual’s risk score in the model was greater than 0.01. (E & H) Heat maps for six CpG sites in the model. The expression patterns of six CpG sites were different between the low-risk group and the high-risk group. 0 represents disease free, and 1 represents cancer-specific death or biochemical recurrence.
(A) The receiver operating characteristic curve for the training group (3, 5 and 7 years). (B–D) Kaplan–Meier curve for survival analysis. (B) The curve for the training group. (C) The curve for the validation group. (D) The curve for the total 201 patients (the 201 patients were randomly divided into the training and validation groups in this study).
AUC: Area under curve; TP: True positive.
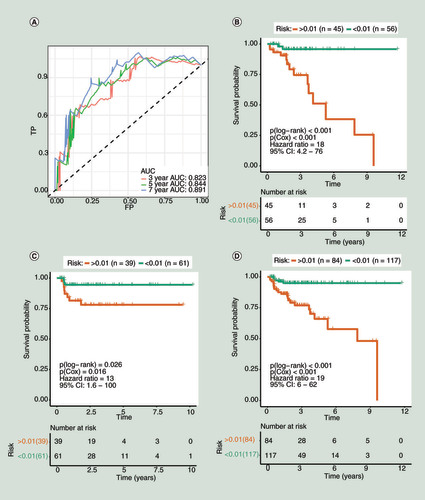
Table 3. The association between methylation status (risk) and clinicopathologic variables of prostate cancer.
Table 4. Univariate and multivariate COX regression for clinical variables and the risk prediction model.
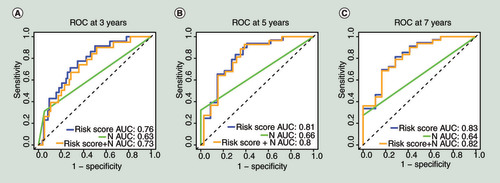
(A) The multivariate time-dependent receiver operating characteristic curve (multi-tdROC)Â at 3Â years. (B) The multi-tdROC curve at 5Â years. (C)Â The multi-tdROC curve at 7Â years.
AUC: Area under curves;Â N: TNM (N);Â ROC: Receiver operating characteristic.
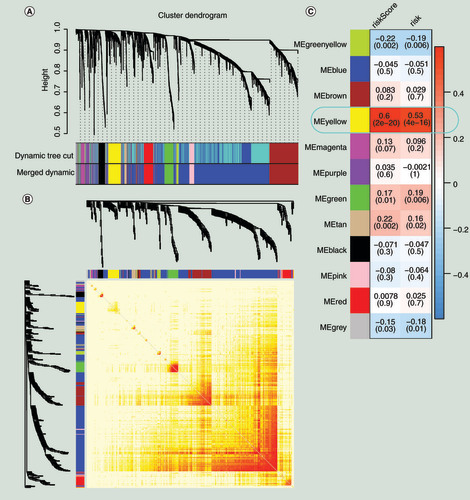
(A) Gene modules divided by weighted correlation network analysis. (B) The heatmap for the topological overlap measure adjacent matrix. The darker the color, the higher the genetic similarity. (C) Identification of the key module.
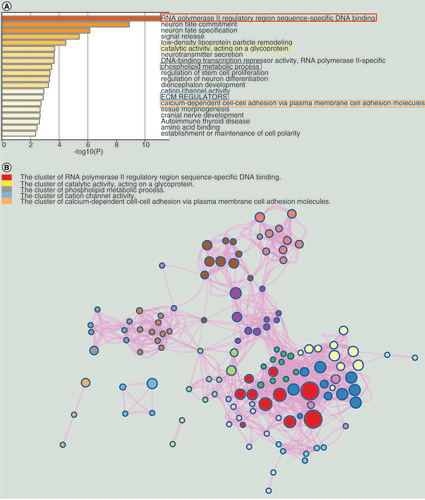
(A) The top 20 enrichment terms. (B) The network of the enrichment terms.
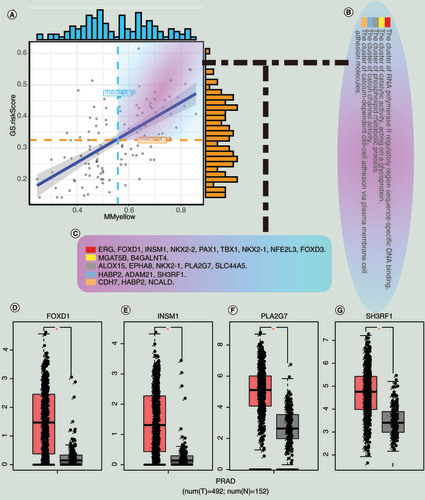
(A) Correlation between MM and GS for the risk scores and the yellow module. (B) The enrichment clusters related to PCa. (C) The candidate hub genes. (D) The expression of hub genes between normal and tumor samples in the Gene Expression Profiling Interactive Analysis database.
GS: Gene significance;Â MM: Module membership; N: Normal sample; PCa and PRAD: Prostate cancer; T: Tumor sample.
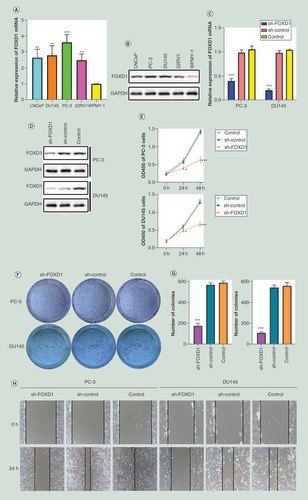
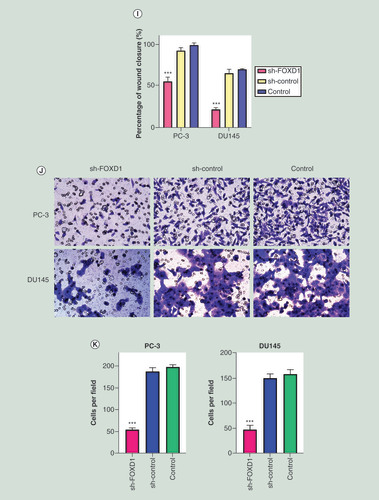
(A) The relative expression of FOXD1 was investigated by quantitative real-time PCR in PCa cell lines LNCaP, DU145, PC-3, 22RV1 and a normal human prostate cell line WPMY-1. GAPDH was used as an internal control. (B) The expression of FOXD1 at protein level was evaluated by Western blot. (C) The relative expression of FOXD1 was investigated by qRT-PCR in PCa cell lines PC-3 and DU145 after lentivirus transfection. (D) The expression of FOXD1 at protein level was evaluated by Western blot after lentivirus transfection. (E) The effects of FOXD1 on the proliferation of PC-3 and DU145 cells were evaluated by Cell Counting Kit-8 tests. (F) The effects of FOXD1 on the proliferation of PC-3 and DU145 cells were evaluated by colony formation tests. (G) Statistical analysis of the results from colony formation assays. (H) The effects of FOXD1 on the migration of PC-3 and DU145 cells were evaluated by wound healing assays. (I) Statistical analysis of the results from wound healing assays. (J) Representative images of transwell assays from control, sh-control and sh-FOXD1 groups of PC-3 and DU145 cells. (K) Statistical analysis of the results from transwell assays. *p < 0.05, **p < 0.01, ***p < 0.001 vs the sh-control group.
Data sharing statement
The authors used DNA methylation data and RNA-seq data from patients with prostate cancer in the TCGA database to train the model and explore therapeutic targets. This study is the first in prostate cancer to construct a DNA methylation risk model and explore therapeutic targets based on the risk prediction model. The datasets used and analyzed during the current study are available from the corresponding author on reasonable request.