Figures & data
(A) The Z-values’ distribution diagram of correlations between gene expressions and CNV or MET based on the samples of pancreatic cancer, respectively. The y-axis represents density profile. Red areas show the correlation between gene expressions and copy number variation. Green areas indicate the correlation between gene expressions and DNA methylation. (B) The overlap between CNVcor genes and METcor genes visualized by the Venn diagram. Red circle stands for the CNVcor genes. Blue circle stands for the METcor genes. The percentage of overlapped genes to CNVcor and METcor genes is 16.9 and 11.5%, respectively. (C) The chromosomal distributions of CNVcor genes are presented in the top panel. The bottom panel indicates the correlations between chromosomes and CNVcor genes. The y-axis in the top panel stands for the ratio of CNVcor genes on different chromosomes. In the bottom panel, the y-axis means the correlation coefficients between CNVcor genes and corresponding chromosomes. (D) The chromosomal distributions of METcor genes. The y-axis stands for the proportion of METcor genes on different chromosomes. (E) The gene function annotation for METcor genes. The x-axis represents ratio of METcor genes separated by different functional types. (F) The distribution proportion of METcor genes locations. The x-axis means proportion of METcor genes separated by different methylated locations.
CNV: DNA copy number variation; MET: DNA methylation.
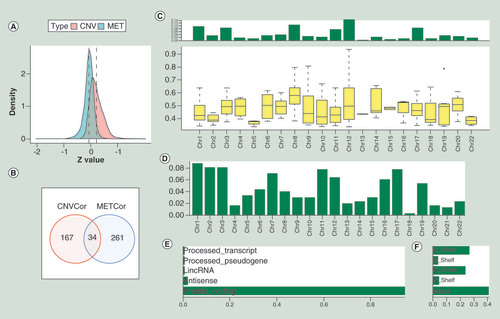
Table 1. The distribution of CNVcor genes on different chromosomes based on the Fisher test.
Table 2. The distribution of METcor genes on different chromosomes based on the Fisher test.
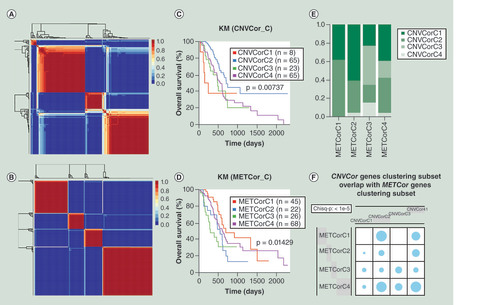
(A) Non-negative matrix factorization clustering map of CNVcor genes. (B) Non-negative matrix factorization clustering map of METcor genes. (C) Kaplan–Meier survival analysis of the four subgroups of CNVcor dataset. (D) Kaplan–Meier survival analysis of the four subgroups of METcor dataset. (E) Overlaps between subgroups of CNVcor dataset and subgroups of METcor dataset. (F) The significant test for overlaps between CNVcor and METcor subgroups. Blue circle stands for overlap between different subgroups and its size represents the proportion of overlap. Chi square test was employed for comparison.
CNV: DNA copy number variation; KM: Kaplan–Meier; MET: DNA methylation.
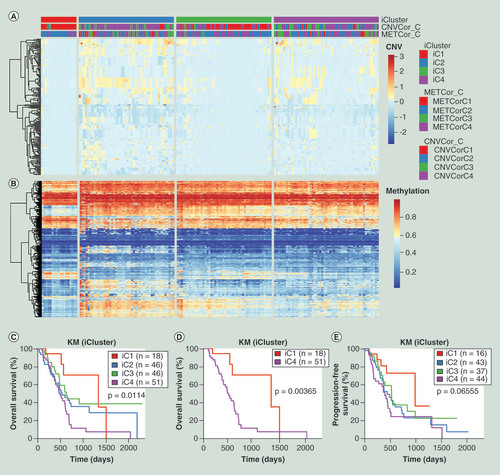
(A) Heatmap of CNVcor genes expression levels of four subgroups (iC1, iC2, iC3 and iC4) identified by iCluster. (B) Heatmap of METcor genes expression levels of four subgroups (iC1, iC2, iC3 and iC4). (C) Kaplan–Meier overall survival analysis of four subgroups (iC1, iC2, iC3 and iC4). (D) Kaplan–Meier overall survival analysis between iC1 and iC4 subgroups. (E) Kaplan–Meier progression-free survival analysis of four subgroups (iC1, iC2, iC3 and iC4).
CNV: DNA copy number variation; EXP: mRNA expression; KM: Kaplan–Meier; MET: DNA methylation.
(A) Correlation between CNV gain and CNV loss frequencies. (B) Correlation between CNV gain and MetHyper frequencies. (C) Correlation between CNV gain and MetHypo frequencies. (D) Correlation between CNV loss and MetHyper frequencies. (E) Correlation between CNV loss and MetHypo frequencies. (F) Correlation between MetHyper and MetHypo frequencies. R stands for Pearson correlation coefficient.
CNV: DNA copy number variation; FDR: False Discovery Rate.
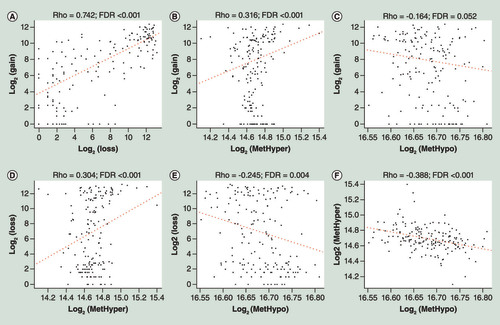
Table 3. The comparisons of clinical features between iC1 and iC2/ iC3/ iC4 subgroups.
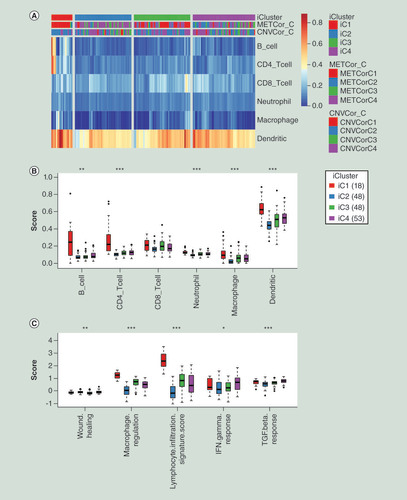
(A) Heatmap of immune scores of total six kinds of immune cells among all samples. iCluster means four subgroups identified by integration of multi-omics data. (B) The comparisons of immune scores of six kind immune cells among four molecular subgroups clustered by iCluster. The Kruskal–Wallis test was employed to calculate the significant level. (C) The comparisons of scores of immune signatures among four molecular subgroups clustered by iCluster. The Kruskal–Wallis test was also used.
*p < 0.05; **p < 0.01; ***p < 0.001.
CNVCor_C: Subgroups of CNVcor genes; METCor_C: Subgroups of METcor genes.
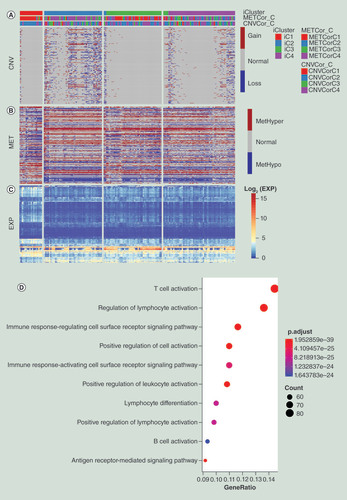
(A) Distribution of CNV of DEGs in the iCluster subgroups. (B) Distribution of MET of DEGs in iCluster subgroups. (C) Distribution of DEGs in iCluster subgroups. The order of genes for heatmap was identical among (A–C). (D) Schematic diagram of GO enrichment analysis results.
CNV: DNA copy number variation; DEG: Differentially expressed gene; GO: Gene ontology; MET: DNA methylation.
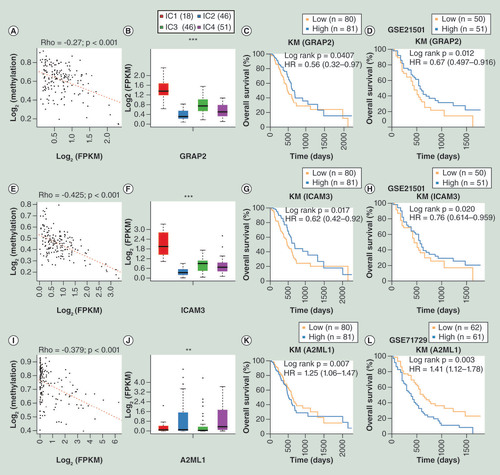
(A) Correlation between GRAP2 gene expression and MET. (B) Relative expression level of GRAP2 among subgroups clustered by iCluster. (C) OS analysis of GRAP2 based on TCGA database. (D) OS analysis of GRAP2 based on external GSE21501 dataset. (E) Correlation between ICAM3 gene expression and MET. (F) Relative expression level of ICAM3 among subgroups clustered by iCluster. (G) OS analysis of ICAM3 based on TCGA database. (H) OS analysis of ICAM3 based on external GSE21501 dataset. (I) Correlation between A2ML1 gene expression and MET. (J) Relative expression level of A2ML1 among subgroups identified by iCluster. (K) OS analysis of A2ML1 based on TCGA database. (L) OS analysis of A2ML1 based on the external GSE71729 dataset.
*p < 0.05; **p < 0.01; ***p < 0.001.
HR: Hazard ratio; KM: Kaplan–Meier; FPKM: Fragments per kilobase of exon per million mapped reads; MET: DNA methylation; OS: Overall survival; TCGA: The cancer genome atlas..
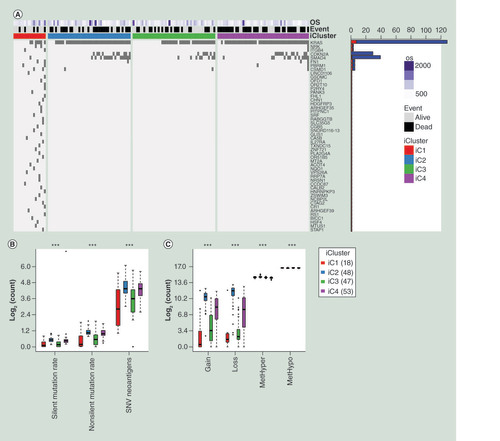
(A) Top 50 mutated genes between iC1 and the other three subgroups, ranking by p-value of the Fisher test. Names of these 50 genes were listed at the right side of the figure. Bar plot at the right side stands for mutational number. Red plot means mutational number of iC1 and blue plot means mutational number of iC2/iC3/iC4. OS means overall survival days. A dark grid represents one mutation. (B) The distribution of different mutational types in the four subgroups of pancreatic cancer. (C) The distribution of CNV gain, CNV loss, MetHyper and MetHypo in the four subgroups of pancreatic cancer. The Kruskal–Wallis test was used.
***p < 0.001
CNV: DNA copy number variation; OS: Overall survival; SNV: Simple nucleotide variation.