Figures & data
Table 1. Patient and lesion characteristics for discovery and validation phases.
Table 2. Biological validation of methylated DNA marker candidates in independent colorectal tissues from Lynch syndrome and sporadic patients.
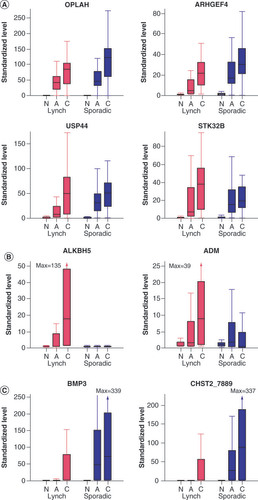
(A) MDMs showing similarly high neoplasm discrimination across Lynch syndrome and sporadic patients. (B) MDMs showing relatively higher neoplasm discrimination in Lynch syndrome patients. (C) MDMs showing relatively higher discrimination in sporadic patients.
A: Adenoma; C: Colorectal cancer; MDM: Methylated DNA marker; N: Normal.
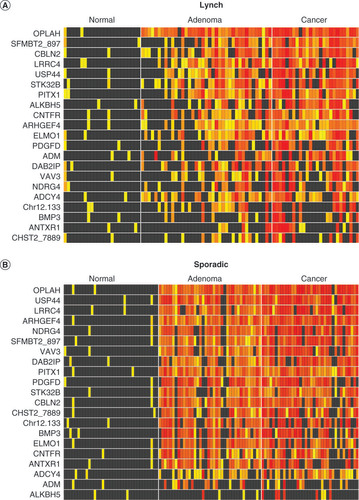
(A) Lynch syndrome and (B) sporadic tissues. Increasing intensity of yellow-red color spectrum in boxes indicates methylation strand counts in deciles above the 90th percentile values for the control groups (histologically normal mucosa) of each candidate methylated DNA marker (rows) in each tissue sample (columns). Black boxes indicate values falling below the 90th percentile in controls.
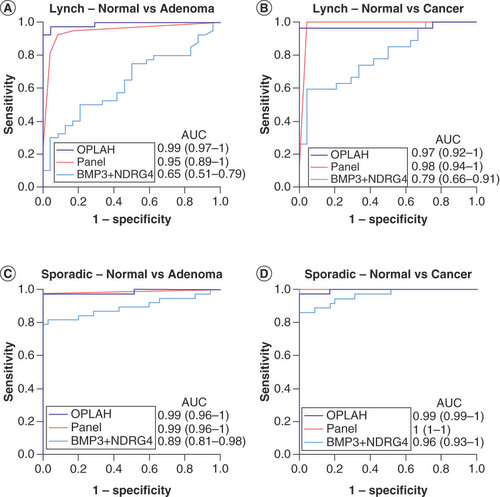
AUC in each graph are shown for OPLAH alone, a panel of novel methylated DNA markers without OPLAH (ARHGEF4, LRRC4, ANTXR1, PITX1) and the combination of BMP3 + NDRG4 with (A) Lynch adenomas, (B) Lynch cancers, (C) sporadic adenomas and (D) sporadic cancers.
AUC: Area under the curve.