
Figures & data
Table 1. Clinical characteristics of patients with fulminant myocarditis.
Table 2. Serological and imaging examinations of patients with fulminant myocarditis during acute phase.
Table 3. Serological and imaging examinations of patients with fulminant myocarditis during convalescent phase.
Table 4. Volunteers demographics.
Table 5. Dilated cardiomyopathy patient demographics.
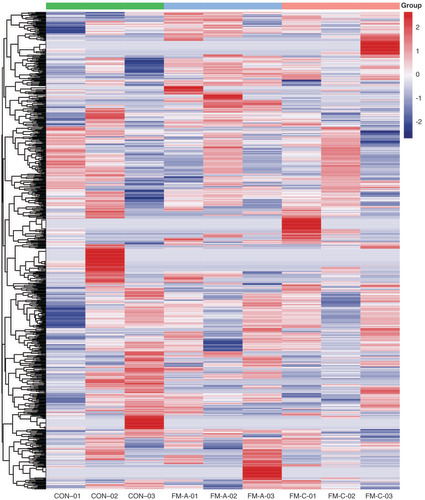
Hierarchical clustering heatmap analysis of tsRNAs expression data of nine samples. Each row represents one tsRNA and each column represents one sample.
CON: Control; FM: Fulminant myocarditis.
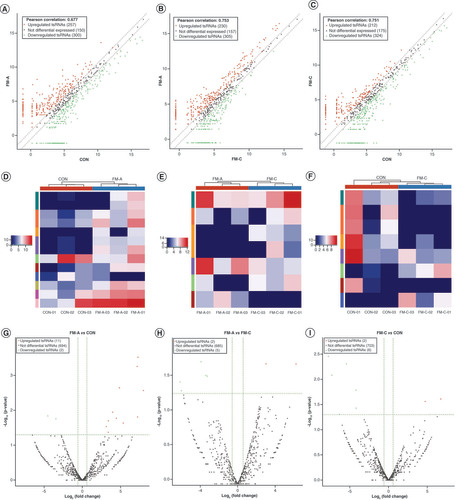
The scatter plot of tsRNAs in three pairwise that is FM-A versus CON (A), FM-A versus FM-C (B) and FM-C versus CON (C). The values of x- and y-axes in the scatter plot are the averaged CPM of each group (log2 scaled). Red/green dots indicate statistically significant differentially expressed tsRNAs with FC ≥1.5. Gray dots indicate nondifferentially expressed tsRNAs. Heatmaps show the hierarchical cluster analysis of differentially expressed tsRNAs in three pairwise between the three groups: FM-A versus CON (D), FM-A versus FM-C (E) and FM-C versus CON (F). Each row represents one tsRNAs and each column represents one sample. Color brightness reflects the degree of expression increase or decrease: red represents high expression, and blue represents low expression. The volcano plot of tsRNAs in three pairwise between the three groups: FM-A versus CON (G), FM-A versus FM-C (H) and FM-C versus CON (I). The values of x- and y-axes in the volcano plot are log2 transformed fold change and -log10 transformed p-values between the two groups, respectively. Red/green circles indicate statistically significant differentially expressed tsRNAs with FC ≥1.5 and p < 0.05. Gray circles indicate nondifferentially expressed tsRNAs.
CON: Control; FM: Fulminant myocarditis.
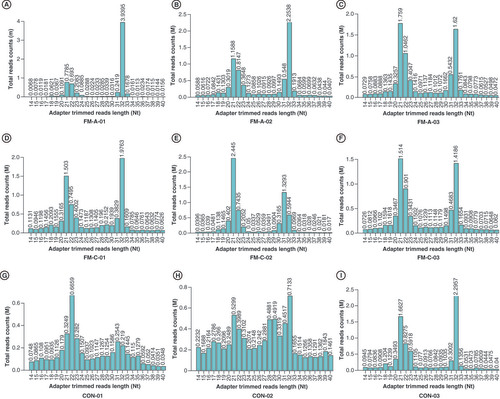
Bar chart shows the total read counts against the lengths for the complete adapter-trimmed read set in the nine samples from FM-A, FM-C and CON groups, respectively. (A) FM-A-01, (B) FM-A-02, (C) FM-A-03, (D) FM-C-01, (E) FM-C-02, (F) FM-C-03, (G) CON-01, (H) CON-02, (I) CON-03.
FM: Fulminant myocarditis.
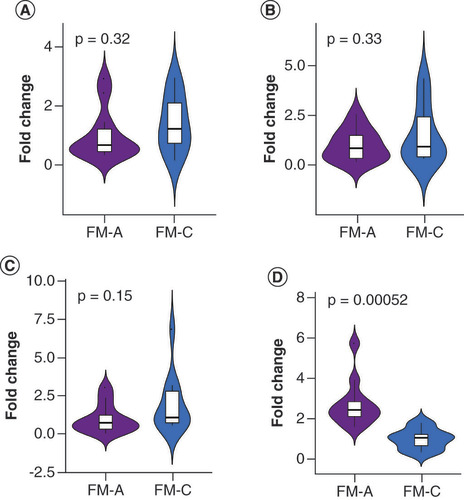
(A) No significant difference was found in tRF-Glu-TTC-004 between the FM-A and FM-C groups (p = 0.32). (B) No significant difference was found in tRF-Lys-TTT-006 between the FM-A and FM-C groups (p = 0.33). (C) No significant difference was found in tRF-Leu-AAG-017 between the FM-A and FM-C groups (p = 0.15). (D) tiRNA-Gln-TTG-001 was 2.72-fold change upregulated in FM-A compared with FM-C (p = 0.00052).
FM: Fulminant myocarditis.
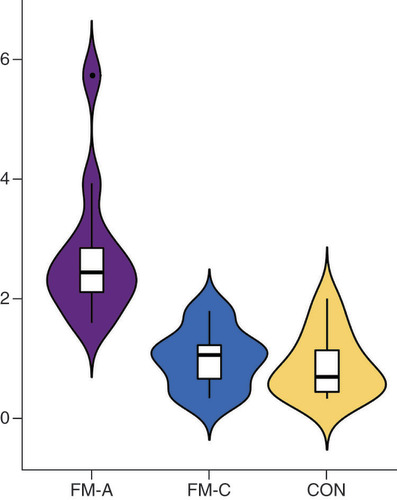
tiRNA-Gln-TTG-001 was found to be overexpressed in FM-A group, with a 2.29-fold increase when compared with FM-C group (p = 0.0000048434), and a 3.49-fold increase when compared with CON group (p = 0.00000053493). There was no statistical difference of tiRNA-Gln-TTG-001 between FM-C and CON groups (p = 0.7335).
CON: Control; FM: Fulminant myocarditis.
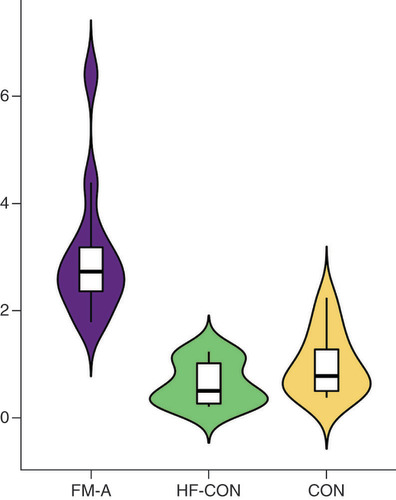
tiRNA-Gln-TTG-001 was found to be overexpressed in FM-A group, with a 5.38-fold increase when compared with HF-CON group (p = 0.000000019589). There was no statistical difference of tiRNA-Gln-TTG-001 between HF-CON and CON groups (p = 0.234).
CON: Control; FM: Fulminant myocarditis.
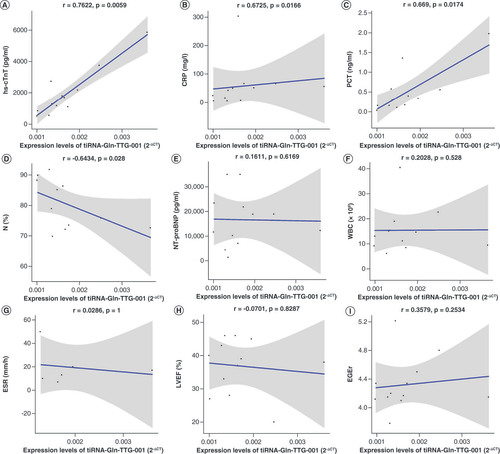
(A) Expression levels of tiRNA-Gln-TTG-001 were positively associated with the values of hs-cTnT (r = 0.7622, p = 0.0059). (B) Expression levels of tiRNA-Gln-TTG-001 were positively associated with the values of CRP (r = 0.6725, p = 0.0166). (C) Expression levels of tiRNA-Gln-TTG-001 were positively associated with the values of PCT (r = 0.669, p = 0.0174). (D) Expression levels of tiRNA-Gln-TTG-001 were negatively associated with the values of N% (r = -0.6434, p = 0.028). (E) The correlation coefficient between levels of tiRNA-Gln-TTG-001 and NT-proBNP (r = 0.1611, p = 0.6169) was not statistically significant. (F) The correlation coefficient between levels of tiRNA-Gln-TTG-001 and WBC counts (r = 0.2028, p = 0.5281) was not statistically significant. (G) The correlation coefficient between levels of tiRNA-Gln-TTG-001 and ESR (r = 0.0286, p = 1) was not statistically significant. (H) The correlation coefficient between levels of tiRNA-Gln-TTG-001 and LVEF (r = -0.0701, p = 0.8287) was not statistically significant. (I) The correlation coefficient between levels of tiRNA-Gln-TTG-001 and EGEr (r = 0.3579, p = 0.2534) was not statistically significant.
EGEr: Early gadolinium enhancement ratio = enhancement myocardium/enhancement skeletal muscle; ESR: Erythrocyte sedimentation rate; FM: Fulminant myocarditis; hs-cTnT: Highly sensitive cardiac troponin T; LVEF: Left ventricular ejection fraction; N%: Neutrophil proportion; NT-proBNP: N-terminal pro-brain natriuretic peptide; PCT: Procalcitonin; WBC: White blood cell.
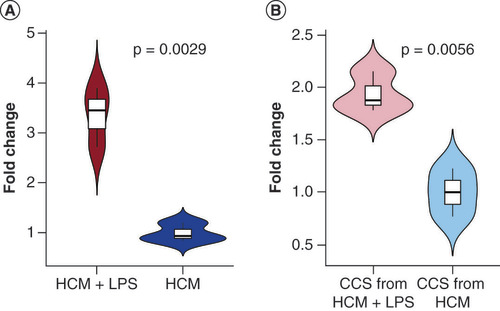
(A) Intracellular tiRNA-Gln-TTG-001 levels were significantly increased following exposure (p = 0.0029). (B) tiRNA-Gln-TTG-001 were significantly increased in the CCS, following exposure (p = 0.0056).
CCS: Cell culture supernatant; HCM: Human cardiomyocyte; LPS: Lipopolysaccharide.
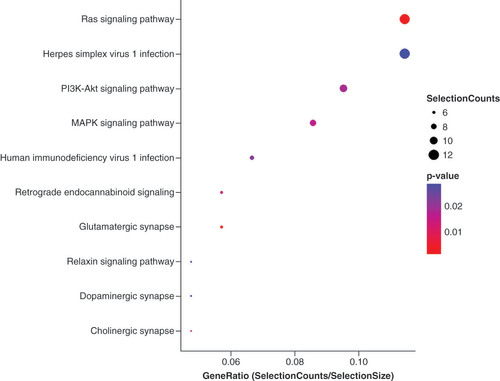
GO: Gene ontology.
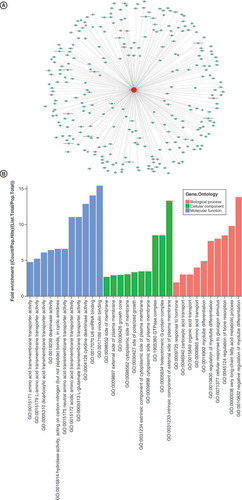
The vertical axis shows the annotated functions of the target genes. The horizontal axis shows the enrichment score (-log10 transformed p-value) and the gene number of each cluster, respectively. Yellow marked nodes are putative molecule in relation to the dysregulated tsRNAs in fulminant myocarditis.
Data sharing statement
The datasets used and/or analyzed in the current study are available from the corresponding author on reasonable request. And the high-throughput sequence data have been submitted to GEO with GEO accession numbers: GSE 163944.