Figures & data
Table 1. Comparison of maternal and infant characteristics between abstinent and binge PAE groups in buccal and placental samples.
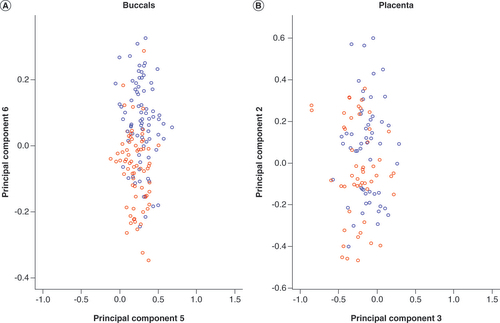
Multidimensional scaling plot of (A) buccal and (B) placenta datasets coloured according to sex. These plots illustrate that DNA methylation variation captured by principal component 6 and principal component 2 in buccal and placenta datasets, respectively, is largely attributed to sex (blue circles: male; red circles: female).
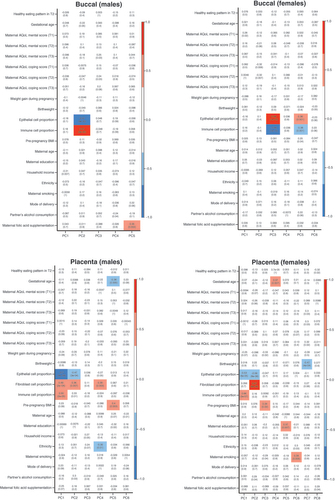
Pearson’s correlation coefficients are listed in each box, along with the p-values in brackets. Strength of correlation is annotated by the color legend. Covariates with a correlation coefficient > ±0.5 and p-values <0.05 were considered to be significantly associated with variation in DNA methylation. Cell type was highly correlated with the top principal components of interest in all groups.
AQoL: Assessment of quality of life; T: Trimester.
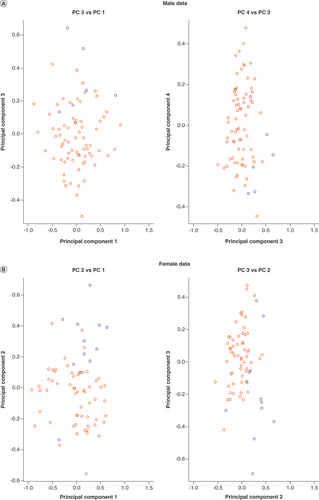
Multidimensional scaling plots illustrate that dataset of non-European origin samples (blue circles) are distinct from European origin samples (red circles), captured by (A) PC 3 for males and (B) PC 2 for females.
PC: Principal component.
(A) Overlapping line plots that depict a potential DMR. Solid and dotted lines denote average DNA methylation (beta) values of binge PAE and control groups respectively for probes annotated to chromosome 8 found within the 10 sum-of-ranked probes. Probes are ordered according to genomic position on the x-axis. The four probes in black boxes (cg23958373, cg07234876, cg26554054, cg15331088) are in the top 10 sum-of-ranked probes that clustered within 1000 bp. The gray box highlights the potential DMR. The two probes (cg05028639, cg24842815) marked with asterisks are the other top 10 differentially methylated probes mapped to ERICH1, 18.2 kb and 33.6 kb 3′ of the potential DMR. (B) Boxplots illustrating beta value differences between control and binge PAE groups of the four clustered probes in the top 10 sum-of-ranked probes. The thick lines in the boxes represent the median, the boxes represent data within the 25th and 75th percentile range, whiskers represent the 5th–95th percentile range. The circles are the outliers.
DMR: Differentially methylated region; PAE: Prenatal alcohol exposure.
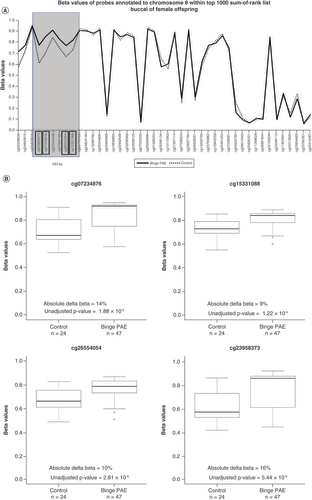
Table 2. Top 10 probes ranked by ‘sum of ranks’ in female buccal (n = 71) and placental (n = 51) datasets.
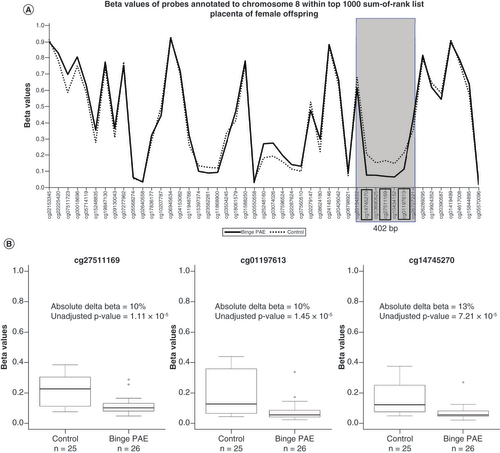
(A) Overlapping line plots that depict a potential DMR; solid and dotted lines denote average beta values of binge PAE and control groups respectively for probes annotated to chromosome 8 found within the top 10 sum-of-ranked probes. Probes are ordered according to genomic position on the x-axis. The three probes in black boxes (cg14745270, cg2751169, cg01197613) are in the top 10 sum-of-ranked probes that clustered within 1000 bp. The gray box highlights the potential DMR. (B) Boxplots illustrate beta value differences of between control and binge PAE groups of the three clustered probes in the top 10 sum-of-ranked probes. The thick lines in in the boxes represent the median, the boxes represent data within the 25th and 75th percentile range, whiskers represent the 5th–95th percentile range. The circles are the outliers.
DMR: Differentially methylated region; PAE: Prenatal alcohol exposure.