Figures & data
(A) Unsupervised hierarchical clustering. Hierarchical clustering of CpGs from PSC, PBC, ALD and HC samples demonstrates that PSC and PBC samples formed relative clusters, while ALD and HCs formed more distinct clusters. (B) Principle component analysis. A clustering plot of CpGs from PSC, PBC and ALD demonstrated that PSC, PBC and ALD samples demonstrated some clustering. (C) Venn diagram of DML. DML were defined as using an absolute methylation difference of >10% and p < 0.01. (D) Venn diagram of Differentially methylated regions (DMRs). DMRs were defined as regions ≥4 CpGs with CpGs ≤100 bases apart, with p < 0.05 and regional methylation difference >5%. PSC, PBC and ALD were compared with HCs to define DMRs for each disease. This demonstrated that there are unique and common DMRs associated with PSC, PBC and ALD when compared with HCs. Note that discrepancies in the total number of DMRs in and this (D) are a consequence of genomic ranges with multiple overlaps.
ALD: Alcoholic liver disease; DML: Differentially methylated loci; HC: Healthy control; PBC: Primary biliary cholangitis; PSC: Primary sclerosing cholangitis; TSS: Transcription start site.
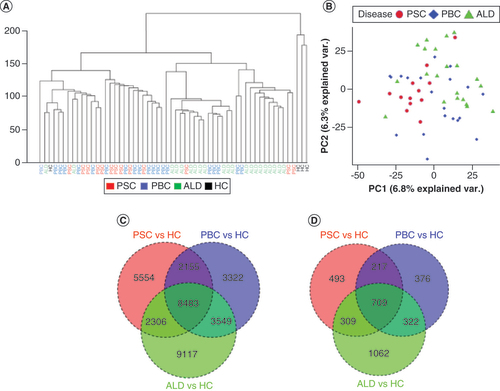
Table 1. Number and proportions of total, hypomethylated and hypermethylated differentially methylated loci and differentially methylated regions in primary sclerosing cholangitis, primary biliary cholangitis and alcoholic liver disease.Table Footnote†
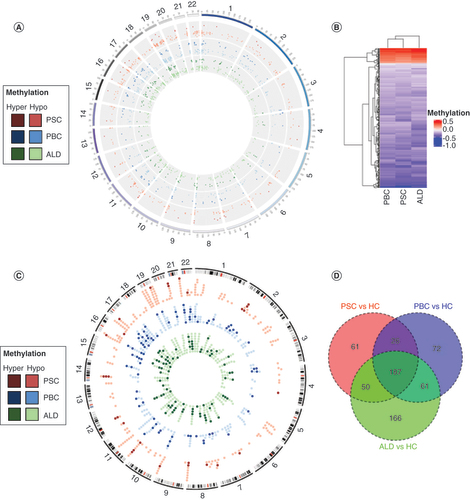
(A) Differentially methylated region (DMR) distribution across the genome. Hypermethylated DMRs are represented by darker colors and hypomethylated DMRs are represented by lighter colors. Each disease is represented by the following colors: PSC in red, PBC in blue and ALD in green. (B) Heat map of DMRs. PSC and PBC were demonstrated to be more similar than ALD using a heat map with hierarchical clustering. Red bars demonstrate hypermethylation and blue bars hypomethylation. (C) Circos plot of differentially methylated genes (DMGs). The majority of DMGs were hypomethylated (light colors), and relatively few were hypermethylated (dark colors). There was no clear distribution across the genome. (D) Venn diagram of DMGs.
ALD: Alcoholic liver disease; HCs: Healthy controls; PBC: Primary biliary cholangitis; PSC: Primary sclerosing cholangitis.
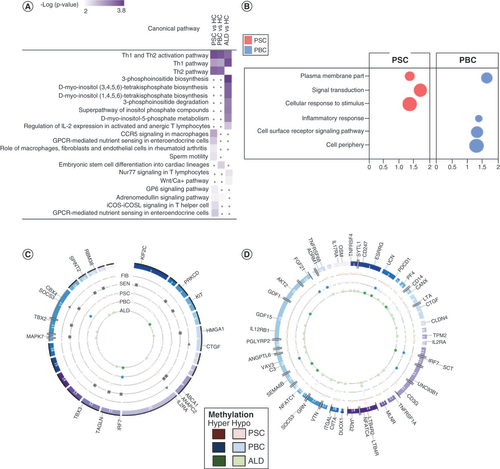
(A) Comparative analysis of canonical pathway enrichment of DMGs. Comparative analysis (Ingenuity Pathway Analysis) was used to identify canonical pathways and their associations with each disease. PSC and PBC were strongly associated with pathways involved in Th2 >Th1 signaling. PSC was also enriched in pathways involved in lymphocyte and macrophage signaling. By contrast, ALD was significantly enriched for Th1 signaling and inositol phosphate metabolism. (B) Pathway enrichment analysis (g:Profiler) demonstrating pathways uniquely and commonly enriched in PSC and PBC. Bubble size represents proportion of candidate genes in PSC and PBC in each pathway, compared with total number of candidate genes. (C) Overlap between differentially methylated genes (DMGs) and known genes involved in fibrosis, senescence, PSC and PBC. Each band in the circular form represents a chromosome with an associated gene. (D) Overlap between DMGs and known genes involved in immune response. Each band in the circular form represents a chromosome with an associated gene.
ALD: Alcoholic liver disease; FIB: Fibrosis; IPA: Ingenuity Pathway Analysis; PBC: Primary biliary cholangitis; PSC: Primary sclerosing cholangitis, SEN: Senescence.
(A) Paired comparisons of differential methylation (differentially methylated regions). PSC demonstrated the greatest relative hypomethylation. Green, hypomethylation; red, hypermethylation. (B) Comparative pathway enrichment between diseases. This demonstrated that PSC and primary biliary cholangitis share similar pathways but that PSC is enriched in a number of distinct pathways.
ALD: Alcoholic liver disease; PBC: Primary biliary cholangitis; PSC: Primary sclerosing cholangitis.
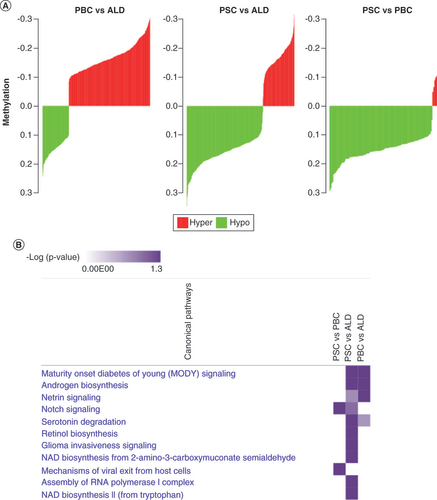
Table 2. Associations between differentially methylated regions, genes and enhancers.
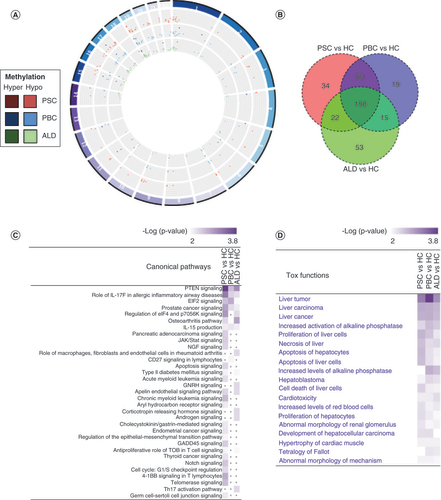
(A) Circos plot of enhancer-associated differentially methylated region (DMR). Virtually all enhancer-associated DMRs were hypomethylated in PSC, relative to PBC and ALD. Hypomethylated DMRs are represented by lighter colors, while hypermethylated DMRs are represented by darker colors. There was no clear distribution across the genome. (B) Venn diagram of enhancer-associated genes. (C) Comparative analysis of canonical pathway enrichment of enhancer-associated genes. Comparative analysis (Ingenuity Pathway Analysis) was used to identify canonical pathways and their associations with each disease. PSC and PBC were highly enriched in pathways involved in cancer and T cell signaling. PSC was again associated with apoptosis signaling. (D) Comparative analysis of toxicity functions. Toxicity functions analysis (Ingenuity Pathway Analysis) was used to identify associations between experimental data and pathology. PSC was associated with hepatocyte apoptosis and necrosis, while all three diseases were associated with malignancy.
ALD: Alcoholic liver disease; DMG: Differentially methylated gene; HC: Healthy control; IPA: Ingenuity Pathway Analysis; PBC: Primary biliary cholangitis; PSC: Primary sclerosing cholangitis; Tox: Toxicity functions.
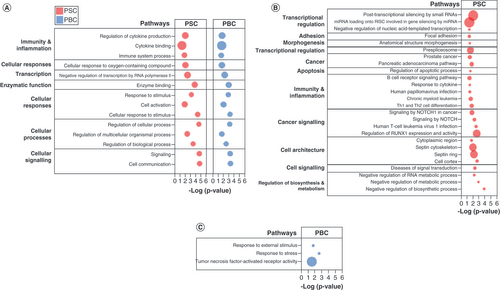
(A) Pathways commonly enriched in PSC and PBC. (B) Pathways uniquely enriched in PSC. (C) Pathways uniquely enriched in PBC. Pathway enrichment analysis performed using g:Profiler. Bubble size represents proportion of candidate genes in PSC and PBC in each pathway, compared with total number of genes in pathway.
DMR: Differentially methylated region; PBC: Primary biliary cholangitis; PSC: Primary sclerosing cholangitis.