
Figures & data
(A) EZH2 and (B)SETD2 expression in HCC and normal tissues. (C)EZH2 and SETD2 co-expressed genes. (D) Functional pathway map of co-expressed EZH2 and SETD2 genes. Correlation of (E)EZH2, (F)SETD2 and (G)EZH2/SETD2 with OS.
***p < 0.05.
HCC: Hepatocellular carcinoma; HR: Hazard ratio; OS: Overall survival; TCGA: The Cancer Genome Atlas.
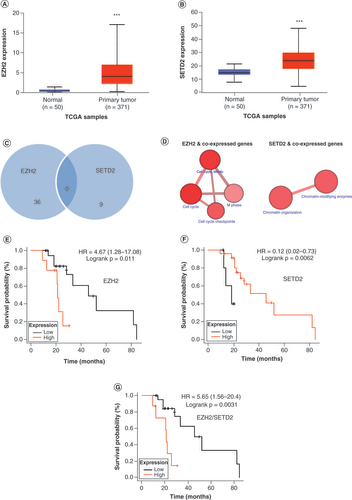
Table 1. H3, H3.1, H3K27me3, H3K36me3 and H3K27me3/H3K36me3 ratio descriptive statistics at studied time points.
Table 2. Univariate analysis of overall and progression-free survival and H3, H3.1, H3K27me3, H3K36me3 and H3K27me3/H3K36me3 ratio baseline values.
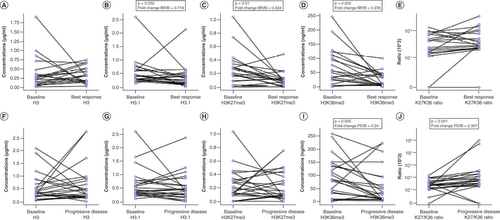
Variations in (A) H3, (B) H3.1, (C) H3K27me3, (D) H3K36me3 and (E) H3K27me3/H3K36me3 ratio (K27/K36 ratio) from B to BR in responders. Variations in (F) H3, (G) H3.1, (H) H3K27me3, (I) H3K36me3 and (J) H3K27me3/H3K36me3 ratio (K27/K36 ratio) from B to PD in all evaluable patients. (E & J) Because of the high dynamic range of values for the H3K27me3/H3K36me3 ratio plot, a mixed linear/log scale was used for the y-axis. Fold change obtained as median biomarker value at BR or PD/median biomarker value at B. Data compared using Wilcoxon signed-rank or paired t-test.
B: Baseline; BR: Best response; PD: Progressive disease.
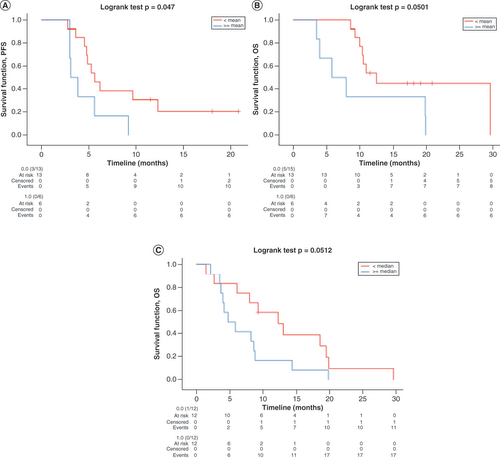
Kaplan–Meier curves for (A) PFS according to H3K27me3/H3K36me3 ratio mean values at BR, (B) OS according to H3K27me3/H3K36me3 ratio mean values at BR and (C) OS according to H3K27me3/H3K36me3 ratio median values at PD. Data for all curves compared using log rank test.
BR: Best response; OS: Overall survival; PD: Progressive disease; PFS: Progression-free survival.
Data sharing statement
The datasets used or analyzed in the current study are available from the first author and corresponding author upon reasonable request.