Figures & data
(A) Right: fluorescent activated sorting of NeuN+ and NeuN- nuclei based on scatter properties and verified with cytospin staining. In short, DAPI signal was removed using forward and side scatter (data not shown), leaving only nuclei (left panel). Selected areas represent selection thresholds for nuclei selection, blue annotated nuclei represent NeuN+ nuclei and orange annotated nuclei represent NeuN- nuclei. The x-axis represents NeuN absorption (nm) spectrum and the y-axis represents Hoechst absorption (nm). The panel on the right side represents the NeuN counts, where the first peak is NeuN- (56%) and the second is Neun+ (37%). (B) Cytospin image confirmation of fluorescent activated sorting procedure of nuclei. Left: NeuN staining, middle: DAPI staining and right: overlay of NeuN and DAPI staining.
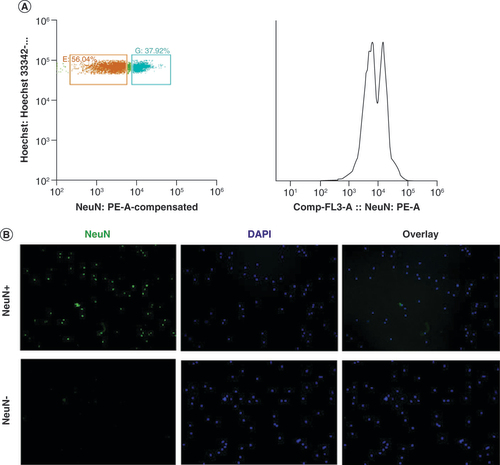
Table 1. Characteristics of cerebrum specimens that passed quality control for both DNA methylation and gene expression data.
(A) Explorative principal component analysis of normalized DNA methylation profiles annotated by group. The x-axis represents the first principal component and the y-axis represents the second principal component. (B) Correlation analysis of the first eight principal components of normalized DNA methylation profiles (x-axis) with the following metadata: group, sex, section of the region, age, cerebrum region, postmortem interval, ethnicity, array and slide position. The y-axis represents the correlation coefficient. (C) Manhattan plot showing the relative percentage of DMPs at a FDR < 0.05. The x-axis represents chromosome number and the y-axis represents relative percentage of DMPs (with respect to the total per chromosome) and separated for direction of effect. (D) Volcano plot DMPs. The x-axis represents delta mean β difference (DS vs controls). The y-axis represents -log10 (FDR). Green dots represent significant DMPs at a delta difference > 0.4. Blue dots represent significant DMPs with a FDR < 0.05. Orange dots represent non-significant DMPs.
DMP: Differentially methylated position.
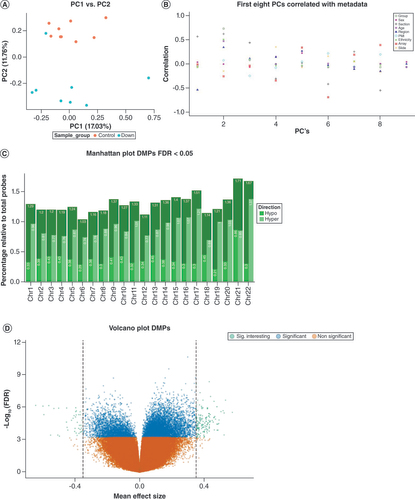
Table 2. Overview of top significant differential associations between Down syndrome and controls.
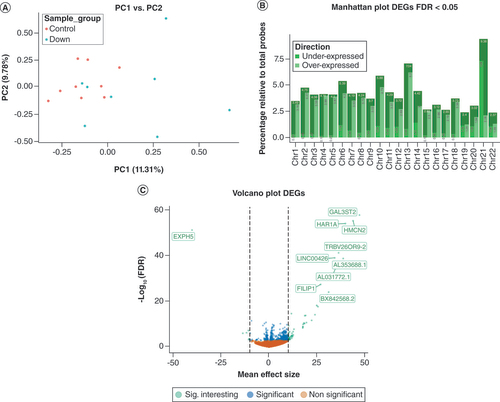
(A) Explorative principal component analysis of gene expression (count) profiles annotated by group. The x-axis represents the first principal component and the y-axis represents the second principal component. (B) Manhattan plot showing the relative percentage of DEGs at a FDR < 0.05. The x-axis represents chromosome number and the y-axis represents relative (with respect to the total per chromosome) percentage of DEGs, annotated for direction of effect. (C) Volcano plot representing DEGs. The x-axis represents -log2 fold change counts and the y-axis represents -log10 (FDR). Green dots represents significant DEGs with mean effect size change >10. Blue dots represent significant DEGs with -log10 (FDR) < 0.05. Orange dots represent non-significant DEGs.
DEG: Differentially expressed gene; FDR: False discovery rate.
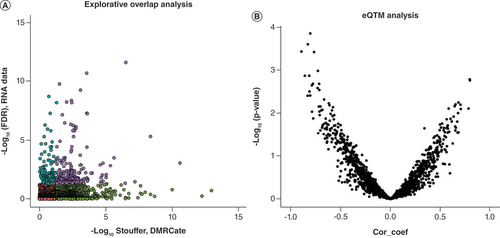
(A) Genomic overlap between Down syndrome-associated DMRs and DEGs. The x-axis represents -log10 Stouffer coefficient of DMRs and the y-axis represents -log10 (FDR) of DEGs. Purple dots represent significant DEG/DMR overlap, blue dots represent significant DEGs, green dots represent significant DMRs and red dots represent non-significant DEG/DMRs. (B) Expression quantitative trait methylation analysis. The x-axis represents the Pearson correlation coefficient between DMRs (median percentage difference of the β-value) and DEGs (-log2 fold change). the y-axis represents -log10 p-value of the Pearson correlation coefficient.
DEG: Differentially expressed gene; DMR: Differentially methylated region; FDR: False discovery rate.
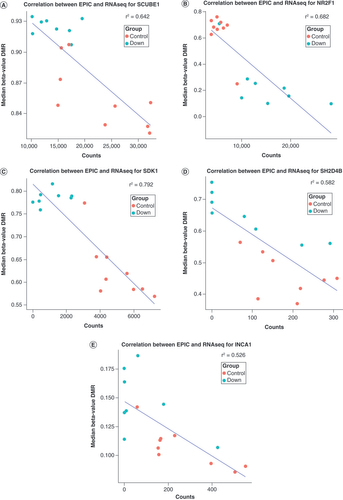
The x-axis represents gene expression count data, and the y-axis represents median percentage difference of the β-value. The blue line represents correlation coefficient. r2 represents the absolute Pearson correlation coefficient. The red dots represent Down syndrome and the blue dots represent controls. (A) eQTM observed for the SCUBE1 gene. (B) eQTM observed for the NR2F1 gene. (C) eQTM observed for the SDK1 gene. (D) eQTM observed for the SH2D4B gene. (E) eQTM observed for the INCA1 gene.