Figures & data
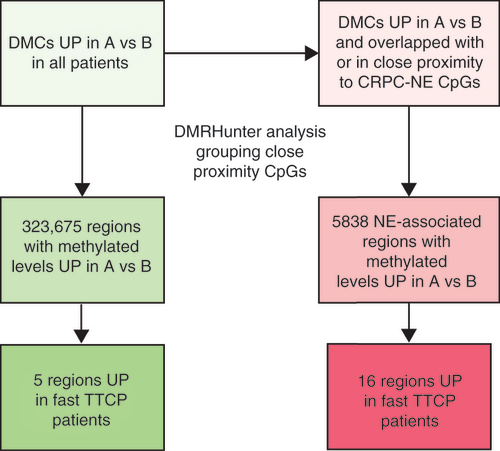
To identify regions associated with clinical progression, DMCs with increased (UP) cfDNA methylation between visits A and B were isolated from our prior sequencing study (green boxes). The proximity of these CpG sites to one another was assessed and regions were defined using the previously established DMRHunter tool. Regions that were differentially methylated in cfDNA from patients who demonstrated a faster TTCP (≤25 weeks) during ARPI treatment were prioritized. Further, DMCs that overlapped with or in close proximity to NE disease-related methylated CpG sites were also examined, and additional regions that were elevated among patients with a faster TTCP were selected as candidates (pink boxes).
cfDNA: Cell-free DNA; DMC: Differentially methylated cytosine; TTCP: Time to clinical progression; NE: Neuroendocrine.
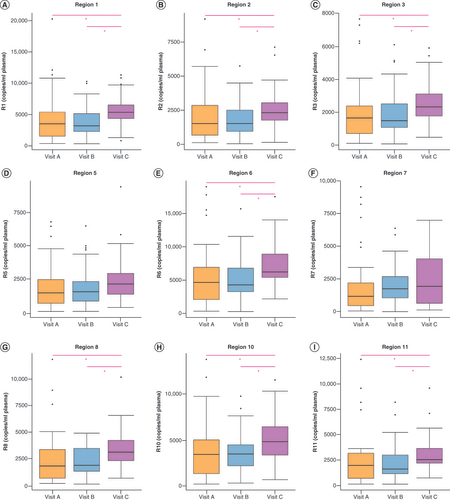
Boxplots show the median, first and third quartile methylation levels (copies/ml) for (A) Region 1, (B) Region 2, (C) Region 3, (D) Region 5, (E) Region 6, (F) Region 7, (G) Region 8, (H) Region 10, and (I) Region 11. Kruskal–Wallis analysis was performed to compare all visits, with pairwise comparisons for significantly altered methylated regions (*p < 0.05). n = 39 patients for visit A, n = 40 patients for visit B, n = 36 patients for visit C.
cfDNA: Cell-free DNA.
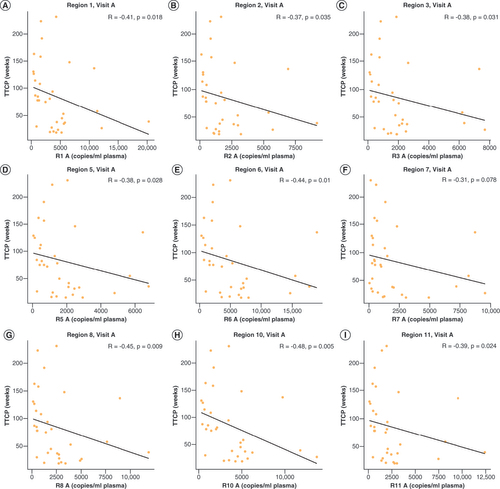
The total methylated copies/ml at visit A was correlated with TTCP (weeks) for (A) Region 1, (B) Region 2, (C) Region 3, (D) Region 5, (E) Region 6, (F) Region 7, (G) Region 8, (H) Region 10, and (I) Region 11. Spearman rho and p-values are shown for all nine regions assessed.
cfDNA: Cell-free DNA; TTCP: Time to clinical progression.
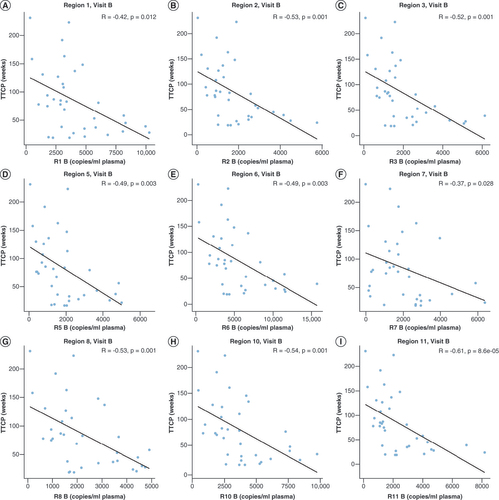
The total methylated copies/ml at visit B was correlated with TTCP (weeks) for (A) Region 1, (B) Region 2, (C) Region 3, (D) Region 5, (E) Region 6, (F) Region 7, (G) Region 8, (H) Region 10, and (I) Region 11. Spearman rho and p-values are shown.
cfDNA: Cell-free DNA; TTCP: Time to clinical progression.