Figures & data
Table 1. Semen parameters of different study groups.
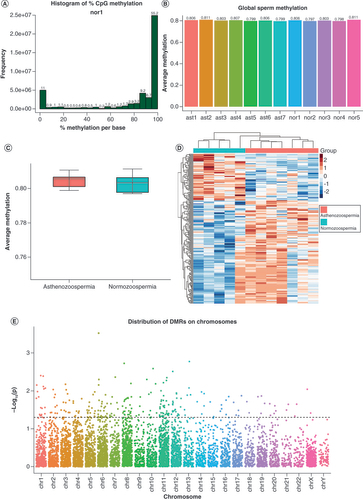
(A) Histogram of methylation values for all CpGs in one representative sample. As expected, it showed bimodal distributions, suggesting a high experimental quality. (B) Global methylation levels of all samples. The ast1-7 and nor1-5 are sample IDs of asthenozoospermia and normozoospermia, respectively. (C) No significant global DNA methylation differences were found between groups (p > 0.05). (D) Heatmap of methylation data z-scores of 238 significantly differentially methylated regions. (E) Distribution of candidate DMRs across chromosomes, where the dotted line represents a threshold of p < 0.05, and dots above the line were chosen as significant DMRs.
DMR: Differentially methylated region.
(A) Count of hypermethylated DMRs and hypomethylated DMRs. (B) Histogram showing the distribution of degrees of methylation difference. (C) Percentage of DMRs in distinct genomic contexts. (D) Relative distances of DMRs to the TSS.
DMR: Differentially methylated region; TSS: Transcription start site.
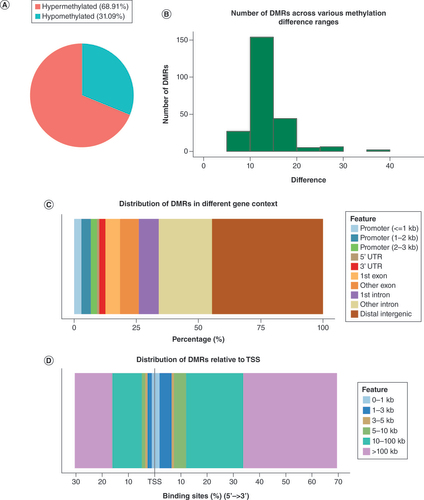
Table 2. Summary of genes harboring differentially methylated regions in their promoter regions.
Table 3. Differentially methylated region(s)-harboring genes involved in sperm functions or spermatogenesis.
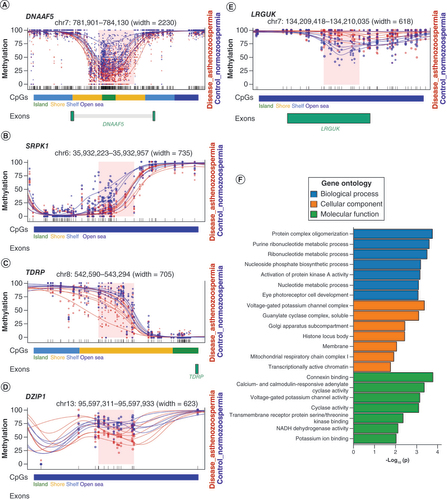
(A–E) Plots of five selected DMRs with regard to genes functioning in sperm motility or spermatogenesis. Each dot represents the methylation level of an individual CpG in a single sample, and the size of the dot is representative of coverage. The lines represent smoothed methylation levels for each sample, either normozoospermic controls (blue) or asthenozoospermic samples (red). CpG annotations are shown below the plot. If the DMR is located in the gene body of a gene, the exon of the gene is also shown below. (F) Gene ontology analysis of biological process, cellular component and molecular function of DMR-annotated genes.
DMR: Differentially methylated region.