
Figures & data
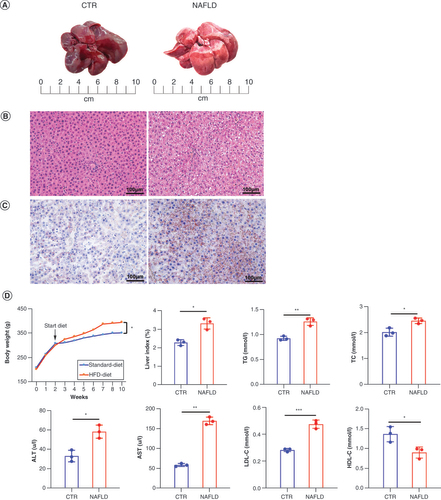
(A) Comparison of liver tissue between CTR and HFD-induced NAFLD groups. (B) Histopathological section of liver tissue by hematoxylin and eosin staining is shown (scale bar: 20 μm; magnification of the microphotograph: 200×). (C) The Oil Red O staining shows the lipid accumulation in livers from the two groups (scale bar: 20 μm; magnification of the microphotograph: 200×). (D) The changes of body weight during the experiment stage, liver index (liver wet weight/body weight), and the serum levels of TG, TC, ALT and AST in two groups were examined respectively. Data are represented as the mean ± standard deviation.
*p < 0.05; **p < 0.01.
ALT: Alanine aminotransferase; AST: Aspartate aminotransferase; CTR: Control group; HDL-C: High-density lipoprotein cholesterol; HFD: High-fat diet; LDL-C: Low-density lipoprotein cholesterol; NAFLD: Nonalcoholic fatty liver disease; TC: Triglycerides; TG: Total cholesterol.
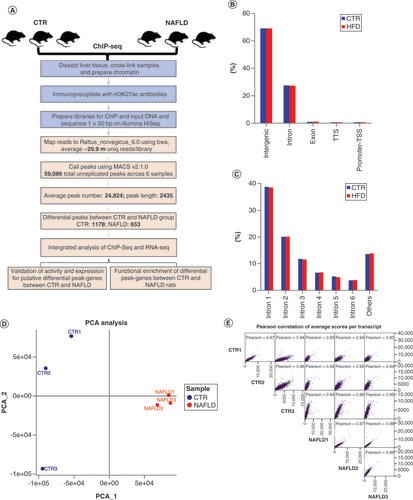
(A) The ChIP-seq analysis with experimental (light blue) steps, computational steps (pink) and summary numbers. (B) Breakdown on H3K27ac enrichment across the genome in the CTR and HFD-induced NAFLD rats. (C) The distribution of the H3K27ac peaks among each intron. (D) PCA of ChIP-seq data for liver tissues in CTR (blue) and NAFLD (red) groups (n = 3/group). (E) Pearson correlation of average scores per transcript of CTR and NAFLD rats.
ChIP-seq: Chromatin immunoprecipitation coupled with high-throughput sequencing; CTR: Control group; HFD: High-fat diet; NAFLD: Nonalcoholic fatty liver disease; PCA: Principal component analysis; RNA-seq: High-throughput RNA sequencing; TSS: Transcript start site; TTS: Transcript termination site.
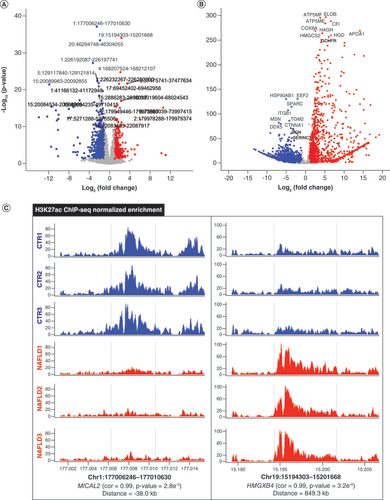
(A) Volcano plot of remarkable differential H3K27ac regions between CTR (n = 1178) and NAFLD (n = 653) samples. (B) Significant differentially expressed genes between CTR (n = 2715) and NAFLD (n = 1041) groups. (C) Differential peak–genes correlated with the representative H3K27ac regions in both CTR and NAFLD groups. The red and blue dots indicate upregulation and downregulation, respectively.
ChIP-seq: Chromatin immunoprecipitation coupled with high-throughput sequencing; Cor: Peak–gene correlation; CTR: Control group; NAFLD: Nonalcoholic fatty liver disease.
(A) The number of positive and negative peak–gene interaction in CTR and NAFLD groups. (B) Distribution of peak–gene correlations against peak–gene distance in CTR groups. (C) Distribution of peak–gene correlations against peak–gene distance in NAFLD groups. The frequency in the middle within 100 kb was more condense than outside with far distance. (D) Genome-wide ‘four-way’ plot showed the genes with a |Cor (peak–gene correlation)| >0.5 and a |log2(FoldChange)| >5 generated by integrated analysis of ChIP-seq and RNA-seq between CTR and NAFLD groups. PP peak–genes with upregulation and positive correlation are colored red, NN peak–genes with downregulation and negative correlation are colored green, PN peak–genes with downregulation but positive correlation are colored blue, and NP peak–genes with upregulation but negative correlation are colored yellow. (E) Overrepresented biological processes of putative target genes associated with differentially hypo- and hyperacetylated peaks by Protein Analysis through Evolutionary Relationships (www.pantherdb.org/). (F) Regulation terms of putative target-genes of differentially hypoacetylated peaks (blue) and hyperacetylated peaks (red) by Database for Annotation, Visualization and Integrated Discovery (https://david-d.ncifcrf.gov/).
ChIP-seq: Chromatin immunoprecipitation coupled with high-throughput sequencing; CTR: Control group; NAFLD: Nonalcoholic fatty liver disease; NN: downregulated peak–genes negatively regulated by H3K27ac; NP: Upregulated peak–genes negatively regulated by H3K27ac; PN: Downregulated peak–genes positively regulated by H3K27ac; PP: Upregulated peak–genes positively regulated by H3K27ac; RNA-seq: High-throughput RNA sequencing.
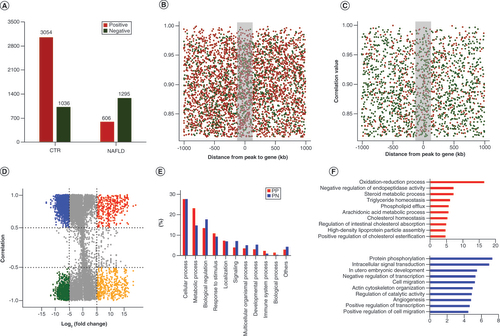
Table 1. The interested peak–genes enriched in the pathways were associated with lipid metabolic and energy homeostasis, etc.
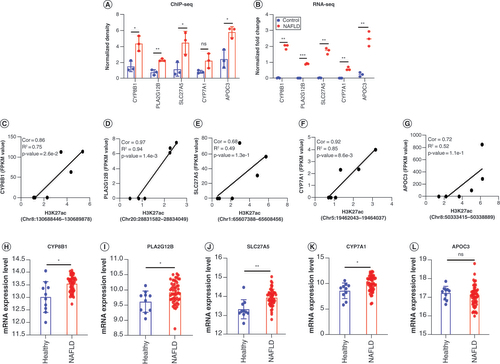
(A) The H3K27ac enrichment of CYP8B1, PLA2G12B, SLC27A5 and CYP7A1 genes in NAFLD rats relative to control groups used by ChIP-seq data. (B) The mRNA expression levels of five genes in the result of RNA-seq. The data of RNA-seq was normalized by lg (initial data +1). (C–G) Correlation plots showed the relationship between the fold enrichment of H3K27ac and expression of these genes: (C) CYP8B1, (D) PLA2G12B, (E) SLC27A5, (F)CYP7A1 and (G) APOC3. (H–L) The transcriptional levels of genes (H)CYP8B1, (I) PLA2G12B, (J) SLC27A5, (K) CYP7A1 and (L) APOC3 in patients with NAFLD relative to healthy individuals in GSE135251. Healthy (n = 10), NAFLD (n = 51) in GSE135251. The data are represented as the mean ± standard deviation. Significance was assessed by t-test.
*p < 0.05; ** p < 0.01; ***p < 0.001.
ChIP-seq: Chromatin immunoprecipitation coupled with high-throughput sequencing; Cor: Peak–gene correlation; NAFLD: Nonalcoholic fatty liver disease; RNA-seq: High-throughput RNA sequencing.
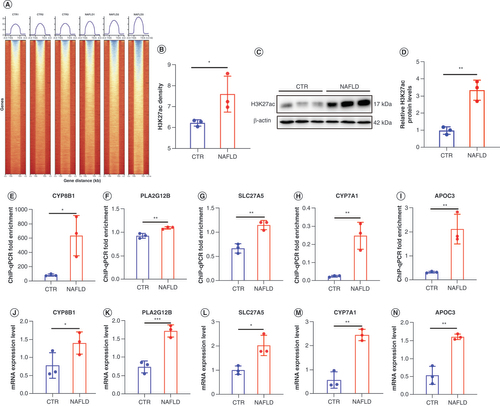
(A & B) Heatmaps show H3K27ac signal at 3 kb near TSS and TES in normal and NAFLD samples. (C & D) Western blot analysis of H3K27ac levels in CTR and NAFLD groups. (E–I) ChIP-qPCR fold enrichment of CYP8B1, PLA2G12B, SLC27A5, CYP7A1 and APOC3 in between CTR and NAFLD rats. (J–N) The mRNA expression level of CYP8B1, PLA2G12B, SLC27A5, CYP7A1 and APOC3 in two groups were detected by real-time PCR. We present the individual data as the mean ± standard deviation. Significance was assessed by t-test
* p < 0.05; ** p < 0.01; ***p < 0.001.
ChIP-qPCR: Chromatin immunoprecipitation coupled with high-throughput sequencing quantitative PCR; CTR: Control group; NAFLD: Nonalcoholic fatty liver disease; TSS: Transcription start site; TES: Transcription end sites.
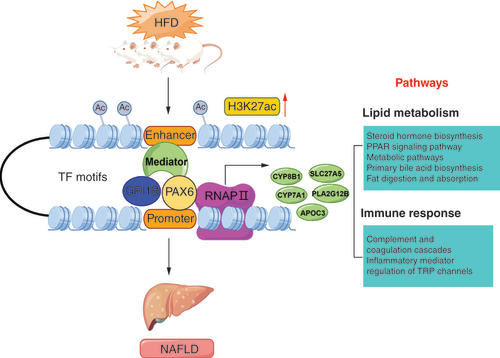
The proposal model demonstrated that HFD could alter the histone H3K27 acetylation, resulting in the remodeling of chromatin structure. Thus, the enhancer recruits more transcription factors including GFI1B and PAX6, promoting the expression of genes (CYP8B1, PLA2G12B, SLC27A5, CYP7A1 and APOC3) enriched in lipid metabolism and immune response related pathways, which contribute to the lipid deposition in liver tissue, involved in the occurrence and development of NAFLD.
This figure was created by Figdraw.
HFD: High-fat diet; NAFLD: Nonalcoholic fatty liver disease; TF: Transcription factor.
Supplemental Figure 1
Download MS Word (1.4 MB)Data sharing statement
All the sequencing data of high-throughput RNA sequencing and chromatin immunoprecipitation will be deposited at the Genome Sequence Archive (https://ngdc.cncb.ac.cn/gsa/) upon acceptance. Three sets of control data of RNA-seq have been deposited at the Genome Sequence Archive repository (https://bigd.big.ac.cn/gsa/browse/ CRA002638). The Gene Expression Omnibus dataset used for this study can be found at https://www.ncbi.nlm.nih.gov/, GSE135251.