Figures & data
Table 1. List of gene primer sequences.
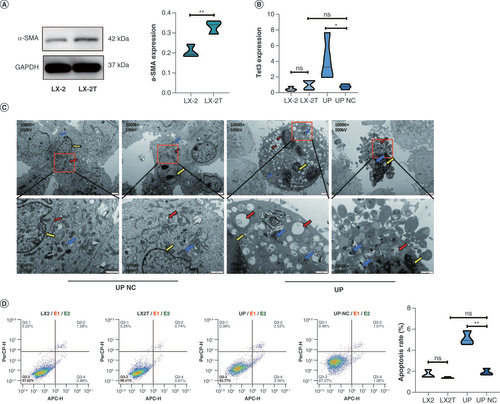
(A) Expression of α-SMA protein in LX-2 and LX-2T (TGF-β) cells detected by western blotting. (B) The mRNA expression of TET3 in LX-2 and LX-2T. TET3 upregulation and TET3 upregulation NC groups was detected by RT-qPCR. (C) Transmission electron microscopy was used to observe cell tissue damage and apoptosis in TET3 upregulation and TET3 upregulation NC groups. Red arrow: endoplasmic reticulum; blue arrow: mitochondrial ridge; yellow arrow: perinuclear space. (D) Flow cytometry was used to detect cell apoptosis in each group.
*p < 0.05; **p < 0.01.
NC: Negative control.
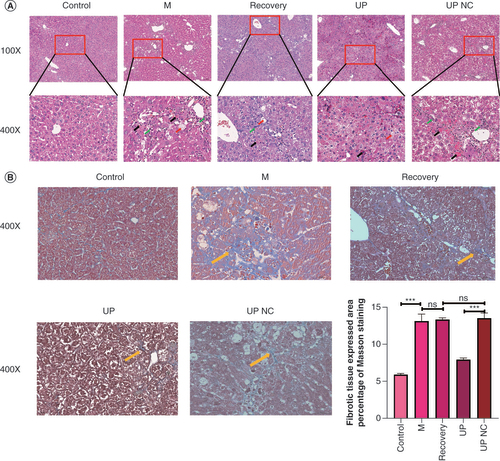
(A) Hematoxylin and eosin staining: fibrous hyperplasia (green arrow), hepatocyte feathery degeneration (red arrow), hepatocyte necrosis (black arrow). (B) Masson stain: fibrous expression (yellow arrow).
***p < 0.001.
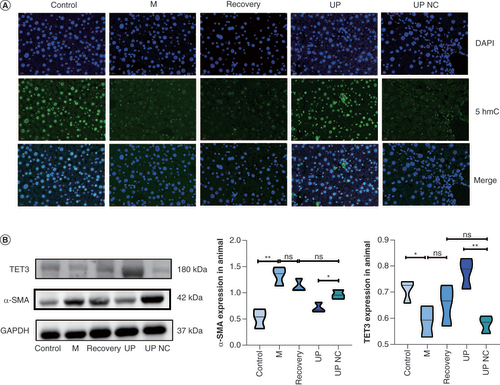
(A) Localization and expression of 5-hydroxymethylcytosine in the liver tissues of mice in the control, M, recovery, TET3 upregulation and TET3 upregulation negative control groups, as detected by tissue immunofluorescence. (B) Western blot analysis showing the protein levels of TET3 and α-SMA in the liver of mice in each group.
*p < 0.05; **p < 0.01.
(A) Kyoto Encyclopedia of Genes and Genomes bubble chart: X-axis represents count/numlnt, Y-axis represents term, bubble size represents count value, bubble color represents -log10 (p-value). (B) Adrenergic signaling in cardiomyocytes pathway. (C) The interaction between CBP and FOXO1 was analyzed based on the biological information base [Citation29]. (D) Chromatin immunoprecipitation revealed the targeting relationship between TET3 and CREBBP.
*p < 0.05; **p < 0.01; ****p < 0.0001.
![Figure 4. TET3 targets CBP/FOXO1–BIM to mediate apoptosis. (A) Kyoto Encyclopedia of Genes and Genomes bubble chart: X-axis represents count/numlnt, Y-axis represents term, bubble size represents count value, bubble color represents -log10 (p-value). (B) Adrenergic signaling in cardiomyocytes pathway. (C) The interaction between CBP and FOXO1 was analyzed based on the biological information base [Citation29]. (D) Chromatin immunoprecipitation revealed the targeting relationship between TET3 and CREBBP.*p < 0.05; **p < 0.01; ****p < 0.0001.](/cms/asset/77e55ae0-7c97-4f04-9f82-390df851d465/iepi_a_12324454_f0004.jpg)
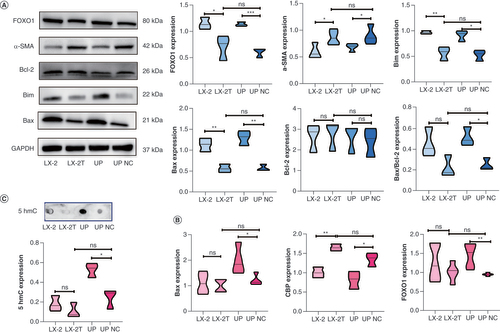
(A) Expression levels of FOXO1, α-SMA, BCL2, BIM and BAX proteins in LX-2, LX-2T, TET3 upregulation and TET3 upregulation negative control groups, as detected by western blotting. (B) RT-qPCR was used to detect the mRNA expression levels of BAX, FOXO1 and CREBBP in each group. (C) The DNA methylation level of 5hmC in each group was detected by dot blot hybridization.
*p < 0.05; **p < 0.01; ***p < 0.001.
NC: Negative control.