Figures & data
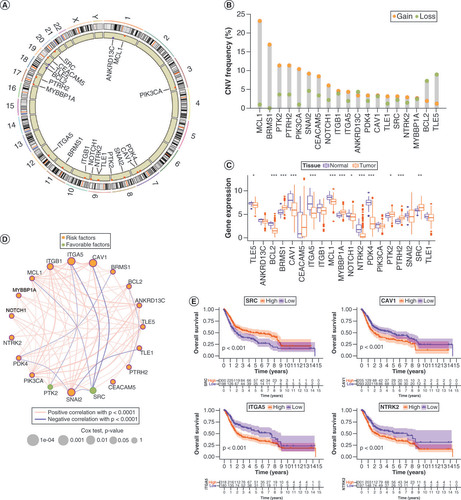
(A) Chromosomal distribution of 19 anoikis regulators (ANRs). (B) CNV in ANRs in patients with bladder cancer (BLCA). (C) Genetic variants in ANRs in 414 patients with BLCA, based on the Gene Set Cancer Analysis database. (D) Summary of ANR genetic variants in 414 patients with BLCA, according to the Gene Set Cancer Analysis database. (E) Kaplan–Meier curves of the indicated ANRs for patients with BLCA.
*p < 0.05; **p < 0.01 and ***p < 0.001.
CNV: Copy number variation.
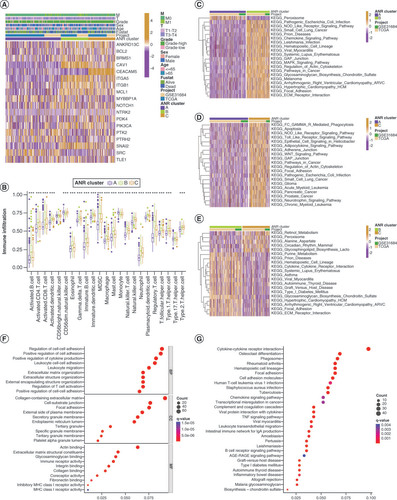
(A) Clinical characteristics and expression of 19 ANRs in three clusters. (B) Differences in immune cell infiltration among the three ANR clusters were analyzed using sample gene set enrichment analysis. (C–E) Gene set variation analysis of Kyoto Encyclopedia of Genes and Genomes (KEGG) terms in pairs of the three ANR clusters. (F–G) Gene Ontology and KEGG enrichment analyses of overlapping differentially expressed genes.
*p < 0.05; **p < 0.01 and ***p < 0.001.
ANR: Anoikis regulator; BP: Biological process; CC: Cellular component; MF: Molecular function.
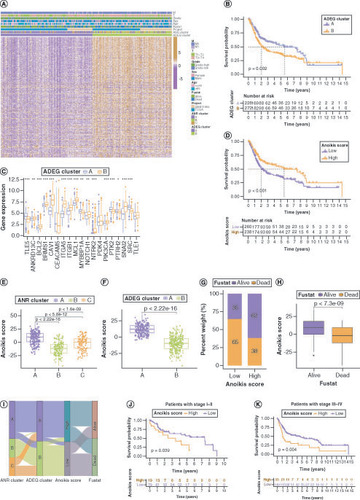
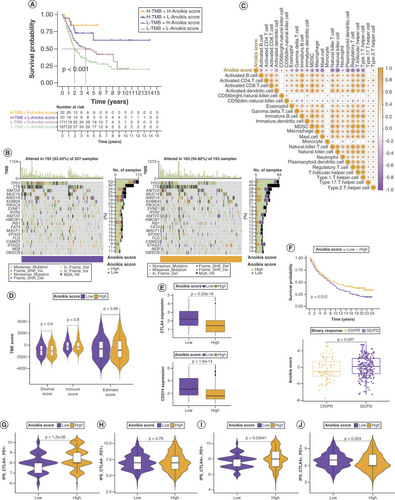
(A) Expression and clinical characteristics of overall survival (OS)-related (ADEGs in two ADEG clusters. (B) Kaplan–Meier curves for patients with bladder cancer (BLCA) in the two ADEG clusters. (C) Differential expression levels of the 19 ANRs in the two ADEG clusters. (D) Kaplan–Meier curves for patients with BLCA in the low- and high-anoikis-score subgroups. (E) Anoikis score differences among the three ANR clusters. (F) Differences in Anoikis scores between the two ADEG clusters. (G & H) Correlation between anoikis scores and the survival status of patients with BLCA. (I) Sankey diagram of the three ANR clusters, two ADEG clusters, anoikis score and survival status of patients with BLCA. Kaplan–Meier curves for patients with BLCA at stage I–II (J) and stage III–IV (K) of tumor node metastasis using our anoikis scoring system.
*p < 0.05; **p < 0.01 and ***p < 0.001.
ADEG: Anoikis-related overlapping differentially expressed gene; ANR: Anoikis regulator.
(A) Kaplan–Meier curves for patients with bladder cancer (BLCA) in the four groups based on anoikis score and tumor mutation burden level. (B) Gene mutations in patients with BLCA with low and high anoikis scores. (C) Correlation between anoikis scores and infiltrating immune cell populations. (D) Comparison of tumor microenvironment scores between the low and high anoikis score groups. (E) Correlation between the anoikis scores and immune checkpoint inhibitor expression. (F) Kaplan–Meier curves and immunotherapy response analysis for patients with BLCA in the IMvigor210 cohort. (G–J) Differences in response to immunotherapy among subgroups with different anoikis scores.
CR: Complete response; IPS: Immunophenoscore; PD: Progressive disease; PR: Partial response; SD: Stable disease.
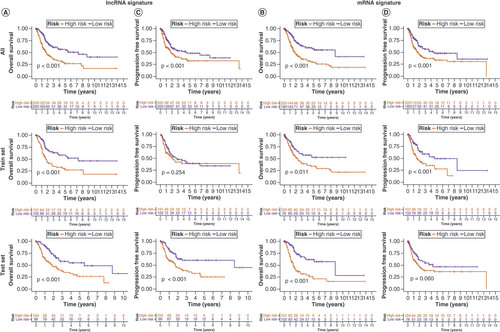
Kaplan–Meier overall survival curves for patients with bladder cancer (BLCA) in the low- and high-risk subgroups of the lncRNA (A) and mRNA (B) risk signatures. Kaplan–Meier progression-free survival curves for patients with BLCA in the low- and high-risk subgroups of the lncRNA (C) and mRNA (D) risk signatures. Univariate and multivariate analyses of independent prognostic value of the lncRNA (E) and mRNA (F) risk signatures. Receiver operating characteristics (ROC) curves for the risk scores of the lncRNA (G) and mRNA (H) risk signatures and other clinical characteristics. ROC curves validating the prognostic capability of lncRNA (I) and mRNA (J) risk signatures at 1, 3 and 5 years, respectively.
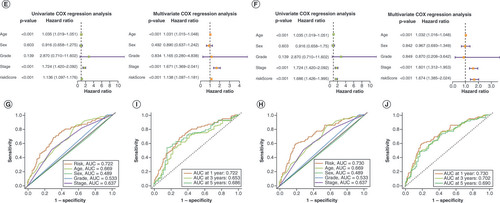
Overall survival probability of patients with bladder cancer at 1, 3 and 5 years was predicted based on nomograms created using the lncRNA (A) and mRNA (B) risk signatures. Calibration curves showing deviation from the predicted results of the lncRNA (C) and mRNA (D) risk signatures. Concordance index values of the risk scores from the lncRNA (E) and mRNA (F) risk signatures. Kaplan–Meier curves for the lncRNA (G) and mRNA (H) risk signatures for low- and high-risk subgroups of patients with bladder cancer (BLCA) according to the tumor–node–metatstasis stage. The distribution of survival statuses of patients with BLCA between low- and high-risk groups for lncRNA (I) and mRNA (J) risk signatures.
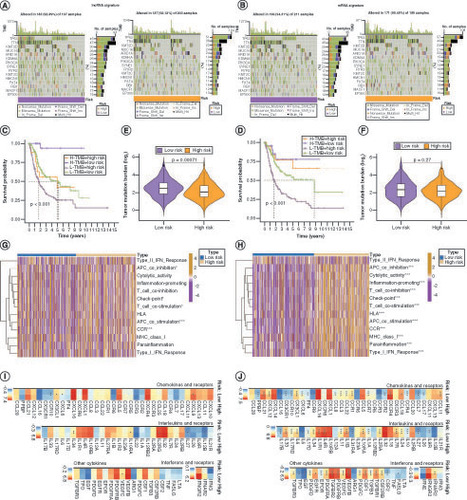
Mutations in lncRNA (A) and mRNA (B) risk signature genes in low- and high-risk patients with bladder cancer (BLCA). (C) Kaplan–Meier curves for the four groups of patients with BLCA based on lncRNA risk and tumor mutation burden (TMB) levels. (D) Kaplan–Meier curves for the four groups of patients with BLCA, based on mRNA risk and TMB. Variation in TMB between the low- and high-risk groups in lncRNA (E) and mRNA (F) risk signatures. Immune functions of genes in lncRNA (G) and mRNA (H) risk signatures. Differences in mRNA expression of cytokines and their receptors in the high- and low-risk groups for lncRNA (I) and mRNA (J) risk signatures.
*p < 0.05; **p < 0.01 and ***p < 0.001.
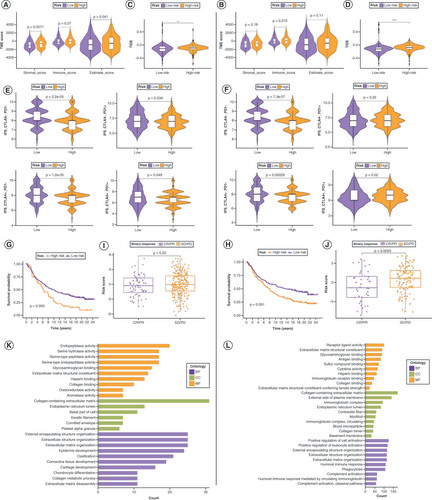
Comparison of tumor microenvironment (TME) scores between the low- and high-risk groups in lncRNA (A) and mRNA (B) risk signatures. (C, D) Variation in Tumor Immune Dysfunction and Exclusion scores between the low- and high-risk groups in the lncRNA (C) and mRNA (D) risk signatures. Differences in response to immunotherapy between the low- and high-risk groups in lncRNA (E) and mRNA (F) risk signatures. Kaplan–Meier curves for patients with bladder cancer (BLCA) in the IMvigor210 cohort after implementation of the lncRNA (G) and mRNA (H) risk signatures. Immunotherapy response analysis for patients with BLCA in the IMvigor210 cohort after the implementation of the lncRNA (I) and mRNA (J) risk signatures. Gene Ontology enrichment analysis of genes in t lncRNA (K) and mRNA (L) risk signatures.
BP: Biological process; CC: Cellular component; CR: Complete response; IPS: Immunophenoscore; MF: Molecular function; PD: Progressive disease; PR: Partial response; SD: Stable disease.