
Figures & data
Table 1. Risk stratification of patients and controls in the discovery, testing and independent validation datasets.
The components were statistically tested against experiment, array plate row, age, sex, disease status and epithelial cell content. The plate-fitted residuals show p = 1.00. Blue = low p-value; red = high p-value.
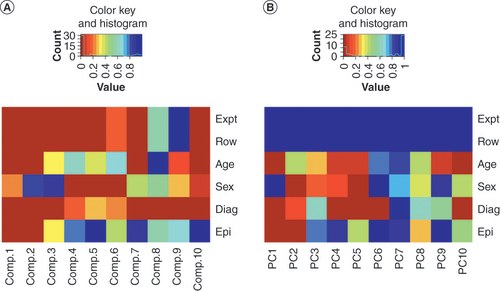
Table 2. Area under the curve for training set and the two holdout sets.
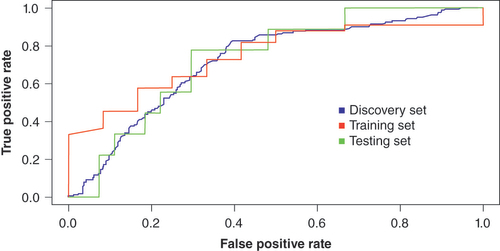
Table 3. Area under the curve using only probes and only covariates of age and sex.
Supplemental material
Supplemental Figure 1
Download PNG Image (555.5 KB)
Supplemental Figure 2
Download PNG Image (487.3 KB)
Supplemental Table 1
Download MS Word (13.6 KB)Data sharing statement
Raw data, processed data and accompanying metadata have been deposited to the Gene Expression Omnibus (GEO) database under the accession code GSE232332.