
Figures & data
(A) Data processing schematic. DNA was extracted from tumor tissues and matched blood samples of 88 bladder cancer patients. After serial preprocessing steps, DNA methylation profiles were applied to estimate cell-type proportions in (B) tumor tissues and (C) blood using HiTIMED and FlowSorted.Blood.EPIC methods respectively.
NLR: Neutrophil-to-lymphocyte ratio.
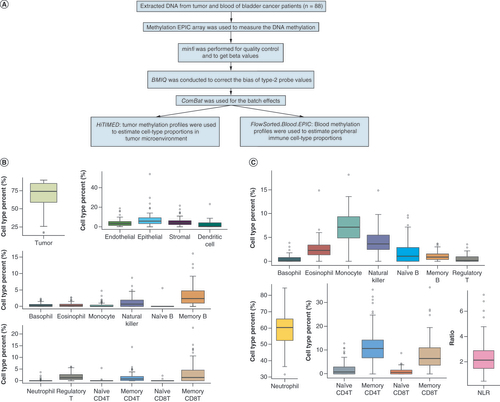
Table 1. Characteristics of the study subjects.
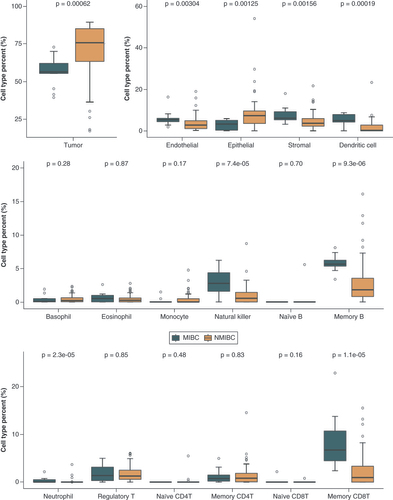
Differences in cell-type proportions between NMIBC and MIBC patients were evaluated using the Wilcoxon rank sum test.
MIBC: Muscle-invasive bladder cancer; NMIBC: Non-muscle-invasive bladder cancer.
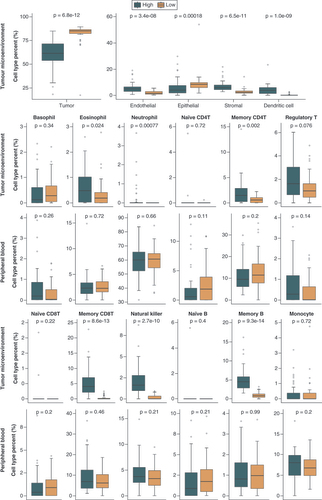
The high immune infiltration group (High) consisted of the 50 patients who had the sum of B, CD8 T, CD4 T, natural killer and dendritic cell proportions >5% in the tumor microenvironment. The low immune infiltration group (Low) consisted of the 38 patients who had the sum of B, CD8 T, CD4 T, natural killer and dendritic cell proportions ≤5% in the tumor microenvironment. Differences in cell-type proportions between two groups were evaluated using the Wilcoxon rank sum test.
Group 1 and group 2 consisted of 43 and 45 patients, respectively. Differences in cell-type proportions between two groups were evaluated using the Wilcoxon rank sum test.
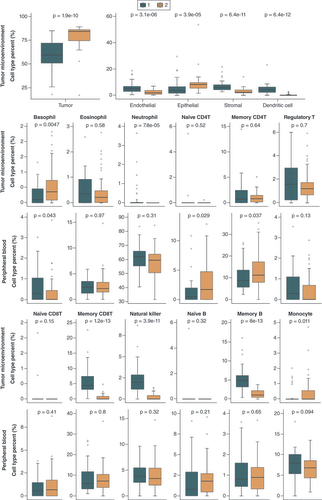
Table 2. The distribution of subject characteristics within groups derived from consensus clustering.
Supplemental Figure 1
Download MS Word (55 KB)Supplemental Figure 2
Download MS Word (36.3 KB)Supplemental Figure 3
Download MS Word (40.2 KB)Supplemental Figure 4
Download MS Word (36.5 KB)Supplemental Figure 5
Download MS Word (263.8 KB)Supplemental Figure 6
Download MS Word (259.5 KB)Supplemental Table 1
Download MS Word (15.3 KB)Supplemental Table 2
Download MS Word (15.7 KB)Supplemental Table 3
Download MS Word (16.6 KB)Supplemental Table 4
Download MS Word (15.4 KB)Supplemental Table 5
Download MS Word (14.5 KB)Data sharing statement
Datasets generated and analyzed in the present study are publicly available in Gene Expression Omnibus (GEO) at GSE237100.