Figures & data
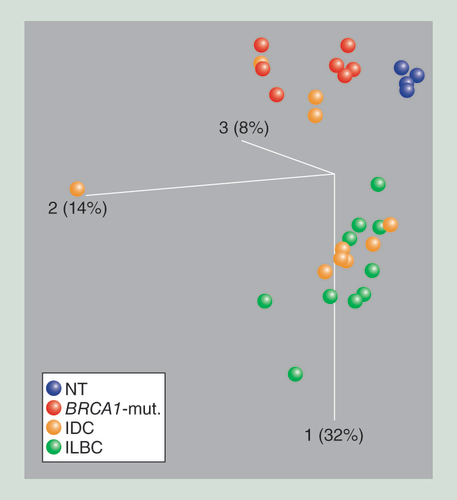
The first principle component is depicted in the vertical axis. Each ball represents 8550 variable CpG sites of one primary tissue specimen (blue: [NT; red: specimens from patients with BRCA1-mut.; orange: IDC samples; and green: ILBCs. NT and BRCA1-mut. samples separate from ILBC samples along the first principle component. IDC do not form an independent group; however, either cluster with ILBC or BRCA1-mutated samples.
BRCA1-mut.: BRCA1-germline mutation; IDC: Invasive ductal breast cancer; ILBC: Invasive lobular breast cancer; NT: Normal breast tissue.
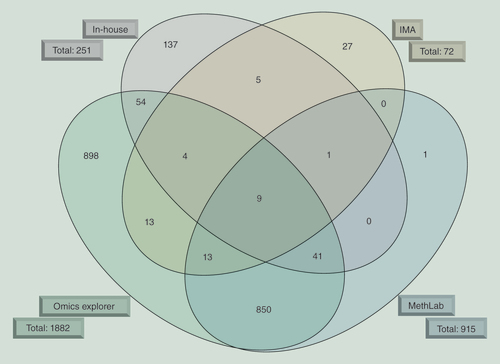
The overlap of differentially methylated genes identified by four different approaches used to analyze the high-throughput data of the HM450K BeadChip is shown. The algorithms are depicted outside the ellipse together with the total number of genes harboring differentially methylated CpG sites.
IMA: Illumina Methylation Analyzer.
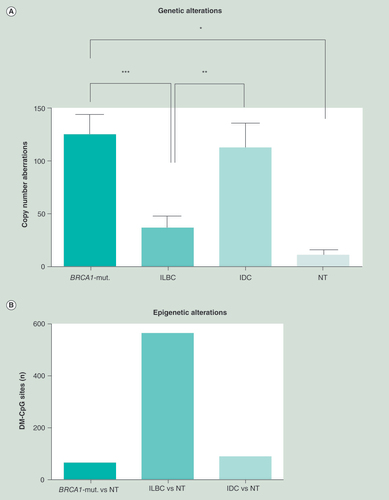
(A) Copy number aberrations for each subgroup were plotted. BRCA1-mutated samples showed the most alterations, with 3.5-fold more than exhibited for ILBC. (B) The number of highly relevant differentially methylated CpG sites (Δbeta-value≥0.4), analyzed by the limma R-package, was determined by the mean of each subgroup compared against the mean of NT for each single CpG site. ILBC show almost 8.4-times more DMR (561 DMR) than BRCA1-mutated (67 DMR). IDC showed 86 DMR compared with NT.
*p < 0.05; **p < 0.01; ***p < 0.001.
BRCA1-mut.: BRCA1-germline mutation; IDC: Invasive ductal breast cancer; ILBC: Invasive lobular breast cancer; NT: Normal breast tissue.
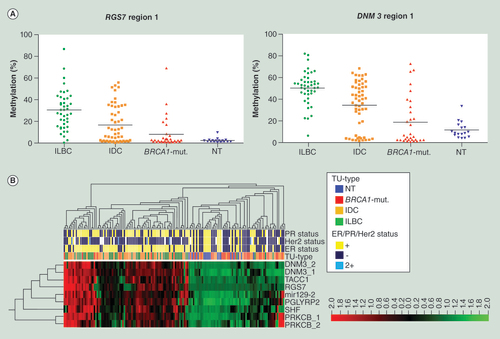
(A) Plotted is percentage methylation (y-axis) within the four subgroups (x-axis). Each dot represents the mean of the sequenced region within one sample, with the black line denoting the mean of each subgroup. (B) Unsupervised hierarchical clustering and heat map analysis was performed on bisulfite pyrosequencing data of 117 primary tissue specimens within nine candidate regions (DNM3 region 1, DNM3 region 2, mir129-2, PGLYRP2, PRKCB region 1, PRKCB region 2, RGS7, SHF, TACC1), for MapInfo see supplementary table s3. ER, PR, Her2 status, and tumor type are color coded according to the legend on the right side. Most BRCA1-mut. samples showed a similar DNA methylation pattern as NT, whereas most ILBC form their own cluster. IDC are more-or-less spread within the ILBC but also the BRCA1-mut./NT cluster. Red = high; black = intermediate; green = low DNA methylation values.
BRCA1-mut.: BRCA1-germline mutation; IDC: Invasive ductal breast cancer; ILBC: Invasive lobular breast cancer; NT: Normal breast tissue.
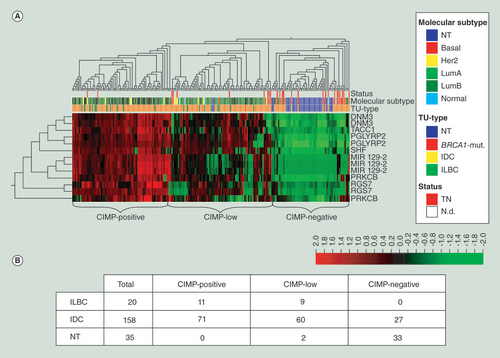
(A) Unsupervised hierarchical clustering and heat map illustration of the candidate DMR within the HM450K BeadChip dataset of the Cancer Genome Atlas. Normal breast tissue (blue) clusters together with the majority of basal-like (middle, red) classified and triple-negative tumors (upper, red). Lobular carcinomas (lower, green) belong to the subgroup of highly methylated tumors on the left side (CIMP-positive). Red = high methylation; green = low or no methylation. (B) The number of ILBC, IDC, and NT comprised within each subgroup identified by the clustering approach.
BRCA1-mut.: BRCA1-germline mutation; IDC: Invasive ductal breast cancer; ILBC: Invasive lobular breast cancer; NT: Normal breast tissue.
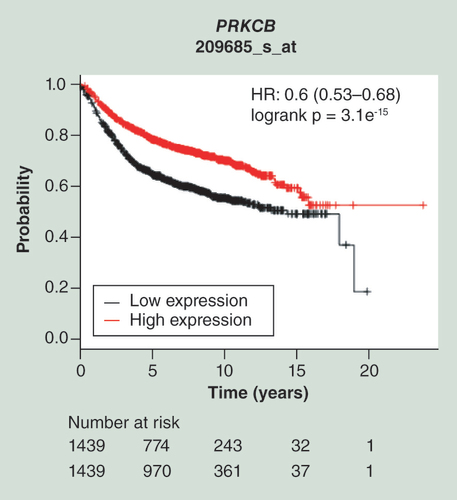
Kaplan–Meier plots of survival data for 2878 patient samples provided by the database of the Kaplan–Meier Plotter is shown for the probe represented by the Affymetrix ID 209685_s_at. Cited is the hazard ratio with the 95% CI and the logrank p-value. The red line represents patient samples overexpressing PRKCB, whereas the black line represents patient data exhibiting lower gene expression values (high expression: above the median; low expression: below the median). Thus, upregulation of PRKCB is associated with a beneficial relapse-free survival.
HR: Hazard ratio.