Figures & data

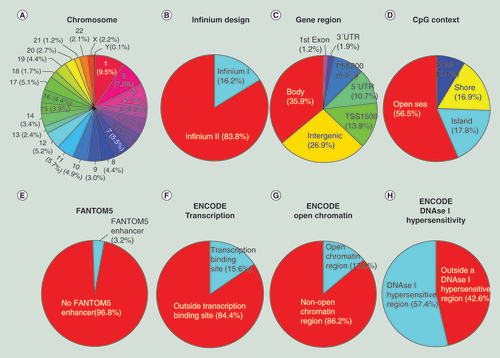
(A) Chromosome location; (B) Infinium design chemistry (Infinium I, II); (C) UCSC gene region feature category (TSS200, TSS1500, 5′UTR, 1stExon, body, 3′UTR); (D) location of the CpG relative to the CpG island (open sea, island, shore, shelf); (E) FANTOM5 associated enhancer regions; (F) ENCODE project annotation for transcription binding site; (G) open chromatin, and (H) DNase I hypersensitive regions.
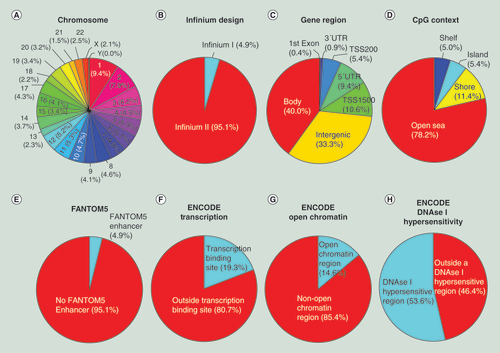
(A) Chromosome location; (B) Infinium design chemistry (Infinium I, II); (C) UCSC gene region feature category (TSS200, TSS1500, 5′UTR, 1st Exon, Body, 3′UTR); (D) location of the CpG relative to the CpG island (open sea, island, shore, shelf); (E) FANTOM5 associated enhancer regions; (F) ENCODE project annotation for transcription binding site; (G) open chromatin and (H) DNase I hypersensitive regions.
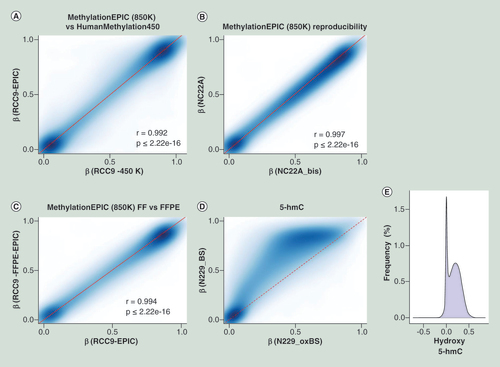
Comparison of methylation values from HumanMethylation450 and their corresponding shared CpG sites present on MethylationEPIC microarray (A) for a renal tumor sample (RCC9). Assay reproducibility (B) of methylation measurements when using technical replicates on a normal colon (NC22A) sample. Correlation plot (C) of the methylation values obtained from a FFPE sample (RCC9-FFPE) when compared with its match biopsy of the same tumor that was preserved as FF (RCC9). 5-hmC value representation (D), where the same sample was treated as per conventional bifsulfite conversion or as per oxBS. Differences on oxBS with bifsulfite conversion are due to the level of 5-hydroxymethylation, where the absence of 5-hmC has been modeled as a discontinue red line. Frequency of hydroxymethylaton values (E) as a result of subtracting the oxBS values (due to 5-mC) from the BS values (due to 5-mC + 5-hmC) for each CpG site included on the 850K array.
5-hmC: 5-hydroxymethylation; FF: Fresh frozen; FFPE: Formalin-fixed paraffin-embedded; oxBS: Oxidative bisulfite conversion.
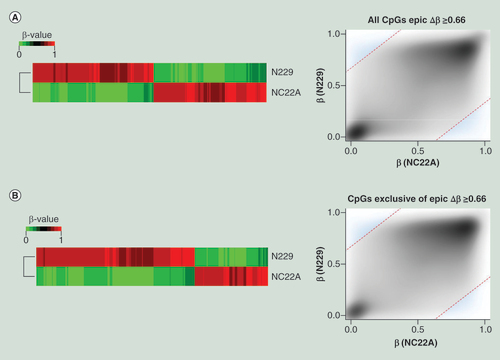
(A) Differentially methylated CpG sites (Δβ ≥0.66 ) on MethylationEPIC BeadChip microarray from a normal colon sample (NC22A), and normal sorted brain neurons (N229). Heatmap representation of differentially methylated CpG sites (left) and methylation values distribution (right) of samples where methylation differences threshold has been denoted as a discontinued red line (Δβ ≥0.66), and those values considered as differentially methylated have been highlighted in blue. (B) Differentially methylated CpG sites (Δβ ≥0.66), among the newly added 413,759 CpG sites of the MethylationEPIC BeadChip microarray, for a normal colon sample (NC22A), and normal sorted brain neurons (N229). Heatmap representation of differentially methylated CpG sites (left) and methylation values distribution (right) of samples where methylation differences threshold has been denoted as a discontinued red line (Δβ ≥0.66), and those values considered as differentially methylated have been highlighted in blue.