Figures & data
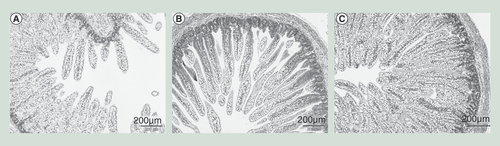
(A) Preterm pigs were fed exclusively with total parenteral nutrition, (B) parenteral nutrition plus formula or (C) parenteral nutrition plus colostrum. The micrographs of the small intestine show no necrotizing enterocolitis-like lesions although the mucosal mass and density was higher in both groups where parenteral nutrition was supplemented with enteral nutrition (formula, colostrum), relative to total parenteral nutrition alone.
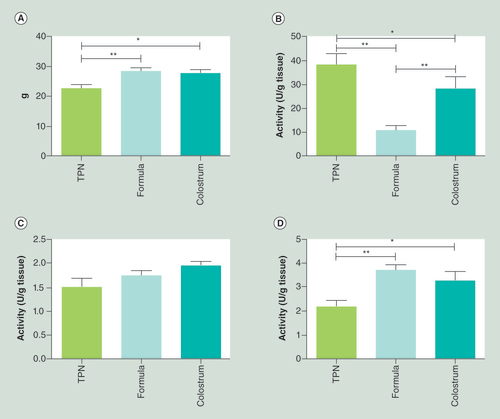
Preterm pigs were fed exclusively with TPN, parenteral nutrition plus formula (formula) or parenteral nutrition plus colostrum (colostrum). (A) Small intestinal weight and (B) enzymatic activities of lactase, (C) dipeptidyl peptidase 4 and (D) ApA differed significantly among the three groups (means ± standard error of mean).
*p < 0.05; **p < 0.01.
TPN: Total parenteral nutrition.
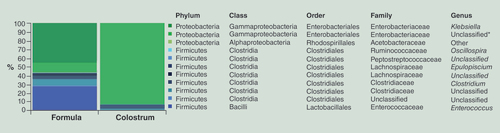
Taxa denoted as ‘Unclassified’ means that the reference database does not have an official taxonomy for this cluster. Taxa denoted as ‘Other’ (unidentified), indicates ambiguity in the assignment meaning that more than one bacterial taxa could be assigned to this cluster. An unclassified genus within the Enterobacteriaceae family was the only taxon significantly different between the two categories (ANOVA p < 0.001*).
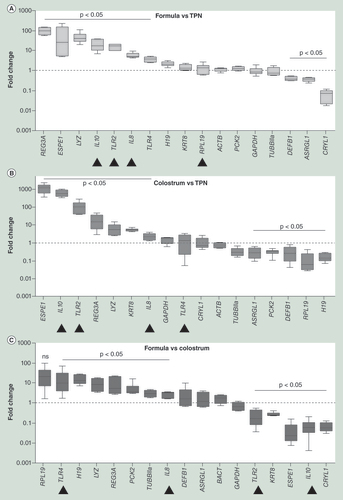
Preterm pigs were fed exclusively with parenteral nutrition (TPN), parenteral nutrition plus formula (formula) or parenteral nutrition plus colostrum (colostrum). Levels of mRNA normalized to GAPDH and ACTB were compared among treatments. Inflammatory and innate immunity genes were substantially upregulated in both (A) formula and (B) colostrum fed pigs when compared to TPN. This effect was much stronger in the formula fed when compared to the (C) colostrum fed pigs. Data are presented as medians ± interquartile ranges, minima and maxima. All experiments were performed in technical triplicates. Arrow heads indicate the most relevant changes.
TPN: Total parenteral nutrition.
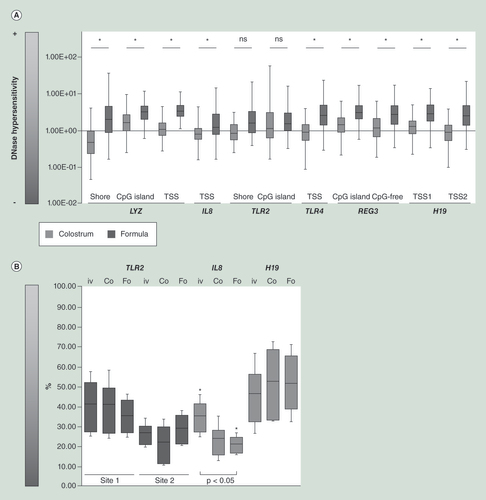
Genes upregulated in formula (dark gray), compared with colostrum (light gray) piglets, such as IL8, TLR4, REG3A and LYZ, were associated with a significantly more open chromatin conformation. (A) TPN-fed piglets were used as reference the groups supplemented with either formula or bovine colostrum. (B) CpG methylation patterns also correlated with mRNA levels. The IL8 locus was significantly less methylated in pigs fed colostrum (Co) and particularly in pigs-fed formula (Fo) when compared with pigs fed (PN) alone (iv). The only exception was TLR2. Methylation levels at the H19 locus were about 50% in all cases reflecting its status as imprinted gene. Data are presented as median ± interquartile ranges, minimum and maximum. All experiments were performed in technical triplicates.
TPN: Total parenteral nutrition, PN: parenteral nutrition.
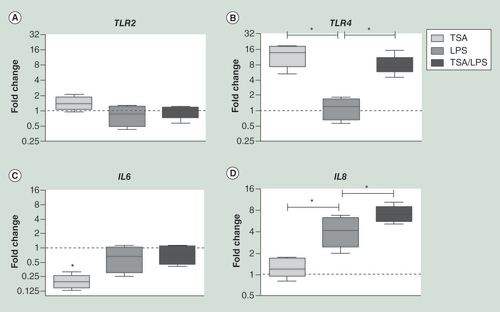
Upon histone deacetylase inhibition using TSA in CaCo-2 cells, TLR4 mRNA levels increased 12.7-fold whereas TLR2 and IL8 mRNA levels remained unchanged. Stimulation with LPS in naïve CaCo-2 cells induced an increase in IL8 mRNA levels. This effect was significantly more pronounced in TSA pretreated CaCo-2 cells. Data are presented as the median ± interquartile range, minimum and maximum. All experiments were performed in technical triplicates.
Asterisks indicate p < 0.05.
LPS: Lipopolysaccharide; TSA: Trichostatin A.