Figures & data
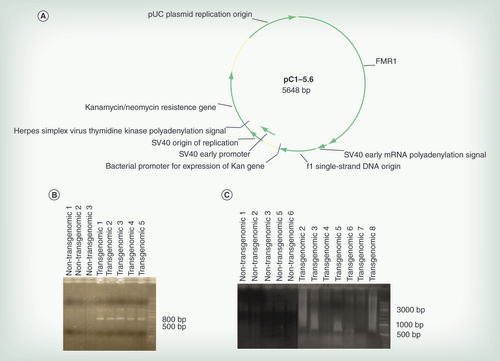
(A) Genetic map of the plasmid. For details see text. (B) Results of PCR analyses on the DNA from HCT116 cell clones as indicated for the presence of the transgenome. Primers placed inside the plasmid were described under Methods. Lanes 01–03 – DNA from nontransgenomic control clones; lanes 04–08 – DNA from plasmid pC1–5.6-transgenomic cell clones. (C) PCR results on DNA from cell clones as indicated using one primer inside the plasmid, the second one in an Alu sequence. The positioning of one primer in Alu sequences of the neighboring cellular DNA and of the second primer inside the plasmid sequence facilitated detection of the integrated plasmid genomes. All primers used were listed under section Methods.
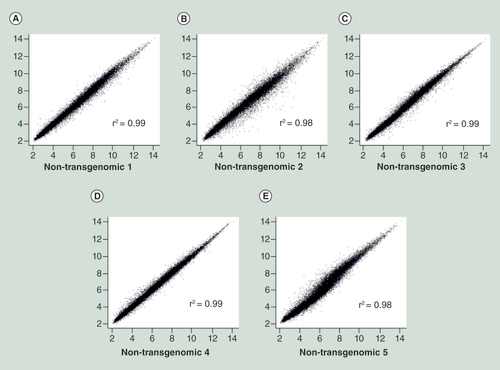
Scatter plots of double determinations from five different single HCT116 cell clones (A–E). X and Y axes display the same clones analyzed in double determinations. See text for details.
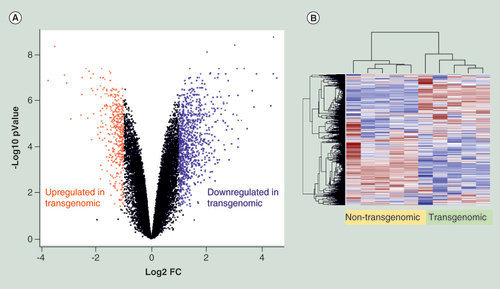
(A) Volcano plot displays nonstandardized signal (log2 fold-change) on the X-axis against standardized signal (-log10 false discovery rate adjusted p-value) on the Y-axis for the comparison of five nontransgenomic against seven transgenomic cell clones of all 28,869 genes analyzed. Upregulated genes in transgenomic cell clones were displayed in red and downregulated genes in blue (fold change ± 2, adjusted p-values < 0.05; n = 1343 genes). (B) Hierarchical cluster analysis of differentially expressed genes. Parameters for cluster calculation: distance = ‘correlation’, linkage = ‘average’. Expression signals were z-transformed. Upregulated genes are indicated in carmine, downregulated genes in blue.
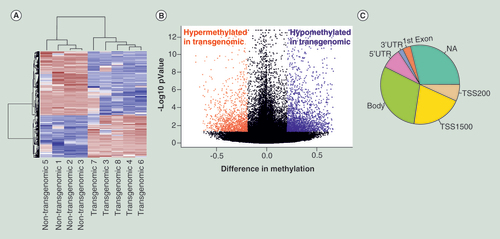
(A) Hierarchical cluster analysis of differentially methylated CpG’s. Parameters for cluster calculation: distance = ‘correlation’, linkage = ‘average’. Upregulated genes are indicated in carmine, downregulated genes in blue. (B) Volcano plot displays differences in methylation on the X-axis against standardized methylation (-log10 false discovery rate adjusted p-value) on the Y-axis for the comparison of four nontransgenomic against five pC1–5.6 transgenomic cell clones of all 361,983 CpG’s interrogated. Hypermethylated CpG’s in transgenomic cell clones are displayed in red and hypomethylated CpG’s in blue (Δβ value ≥0.2, adjusted p-value < 0.05; n = 3,791 CpG’s). (C) Pie chart indicates structural characteristics of differentially methylated CpG sites. Methylation changes found in different genes have been assigned to specific parts of these genes:
Body of gene (body); 5′UTR, 3′UTR, first exon are self- explanatory; NA not assigned; TSS transcription start site.