Figures & data
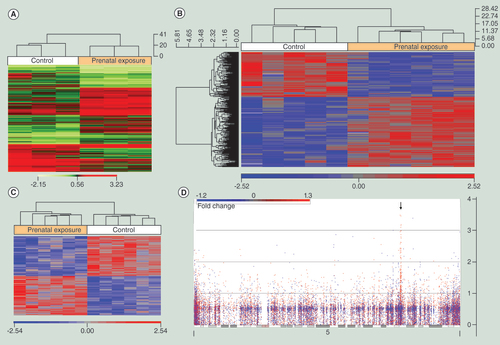
(A) Heatmap of top significant (p < 0.01) contigs from the adult mouse prenatally exposed to alcohol. (B) Heatmap of significantly (p < 0.005) differentially methylated targeted CpG sites generated using hierarchical clustering of buccal epithelial DNA obtained via swab from fetal alcohol spectrum disorders (n = 6) and matched control (n = 5) children from the discovery cohort. (C) Heatmap of significantly (p < 0.005) differentially methylated targeted CpG sites generated using hierarchical clustering of buccal epithelial DNA obtained via swab from fetal alcohol spectrum disorders (n = 6) and matched control (n = 6) children from the replication cohort. (D) Manhattan plot for human chromosome 5 from the discovery sample. Genomic location is plotted on the x-axis and –log10 (p-value) of differential CpG methylation from prenatal alcohol exposure is on the y-axis. Each dot represents a single CpG site. A red dot indicates an increase in methylation and a blue dot indicates a decrease in methylation. The black arrow identifies clustered protocadherin genes on 5q31.
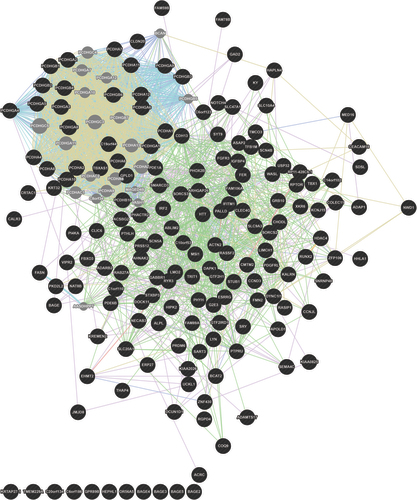
The network highlights preferential and synchronous alteration involving Protocadherin genes in children with fetal alcohol spectrum disorders.
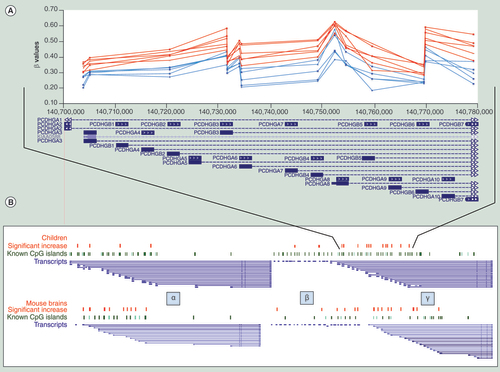
(A) Representative methylation patterns in 14 CpGs in the gamma cluster in six fetal alcohol spectrum disorders children and their five matched controls. (B) Significantly (p < 0.005) increased methylation in the clustered protocadherin region of patients (red dots), known CpG island (green dots) and potential transcripts (blue lines) along with their similarity to the mouse model (p < 0.01). Figure is not to scale as non-informative regions have been removed for clarity.
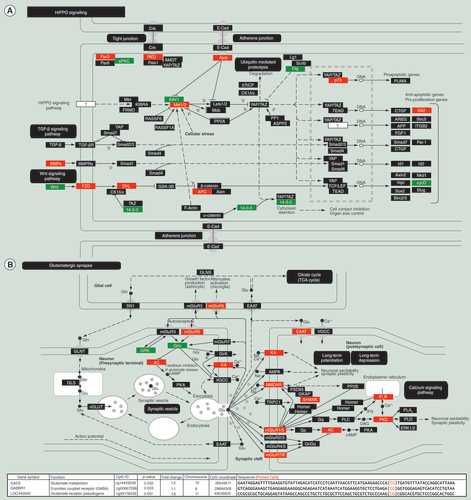
Genes were identified and then assembled as protein complexes. (A) Hippo signaling; (B) glutamatergic synapse pathway. Green marks a decrease in methylation and potentially increased gene expression while red indicates a increase in methylation and potentially decreased gene expression.