Figures & data
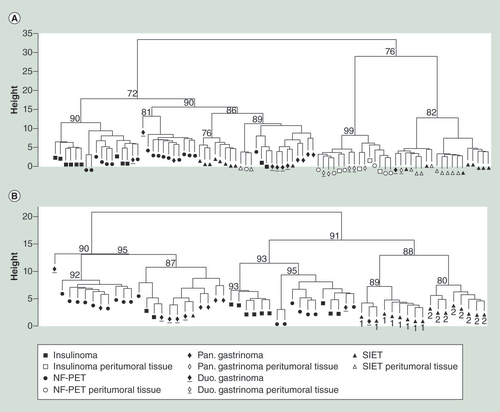
(A) Dendrogram of all tumoral and all peritumoral samples. (B) Dendrogram of all tumoral samples. Values above each cluster correspond to the approximately unbiased value obtained after 10,000 multiscale bootstrap resampling tests. The numbers under the SIETs in the dendrogram presented in the (B) panel correspond to the two groups of SIETs identified according to the cluster analysis presented in the (A) panel (1 or 2 for the SIETs clustering respectively with the SIET peritumoral samples or the other tumors).
Pan.: Pancreatic; Duo.: Duodenal; NF-PET: Non-functioning pancreatic endocrine tumor; SIET: Small intestine endocrine tumor.
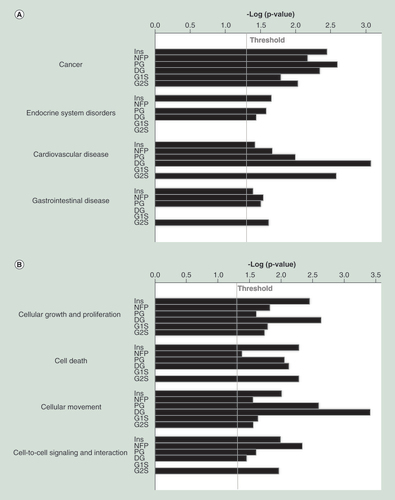
(A) Diseases and disorders. (B) Molecular and cellular functions. The threshold represents a p-value of 0.05.
DG: Duodenal gastrinoma; G1S: Group 1 small intestine endocrine tumors; G2S: Group 2 small intestine endocrine tumors; Ins: Insulinomas; NFP: Non-functioning pancreatic endocrine tumor; PG: Pancreatic gastrinoma; SIET: Small intestine endocrine tumor.
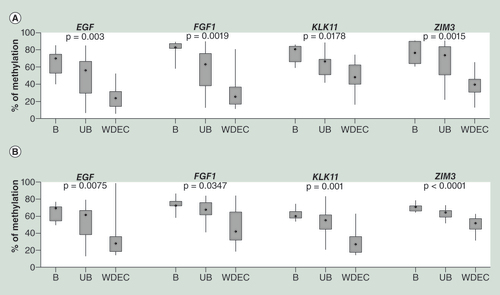
(A) Methylation level of EGF, FGF1, KLK11 and ZIM3 according to GoldenGate. (B) Methylation level of EGF, FGF1, KLK11 and ZIM3 according to pyrosequencing. Statistical significance of DNA methylation differences between the three histological groups using the GoldenGate and pyrosequencing was assessed by the nonparametric Kruskal–Wallis test.
B: Benign; UB: Uncertain behavior; WDEC: Well-differentiated endocrine carcinoma.
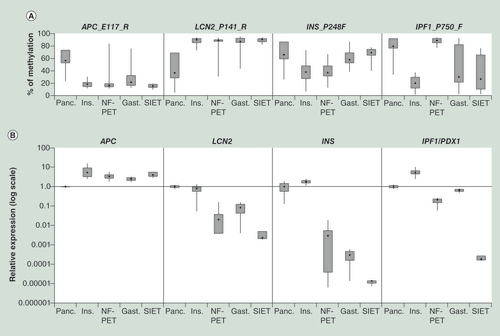
(A) The DNA methylation level obtained by the BeadArray analysis in function of the tumor types. (B) Relative expression level according to tumor type.
Gast.: Gastrinomas; Ins.: Insulinomas; NF-PET: Non-functioning pancreatic endocrine tumor, Panc: Pancreatic normal/peritumoral tissue; SIET: Small intestine endocrine tumor.