
Figures & data
These images depict a nonfasting or postprandial state with lipoprotein in plasma of both intestinal (chylomicrons and chylomicron remnants) and hepatic origin (VLDL, VLDL remnants = intermediate-density lipoproteins) and LDL. LDLs and remnants cross the endothelial layer of intima in a process dependent on blood pressure, lipoprotein size and lipoprotein concentration, possibly involving transcytosis.
Modified with permission from [Citation10].
![Figure 1. Elevated triglyceride-rich lipoproteins and atherosclerotic plaque initiation, plaque progression and plaque rupture causing myocardial infarction or ischemic stroke.These images depict a nonfasting or postprandial state with lipoprotein in plasma of both intestinal (chylomicrons and chylomicron remnants) and hepatic origin (VLDL, VLDL remnants = intermediate-density lipoproteins) and LDL. LDLs and remnants cross the endothelial layer of intima in a process dependent on blood pressure, lipoprotein size and lipoprotein concentration, possibly involving transcytosis.Modified with permission from [Citation10].](/cms/asset/302c47c0-896a-44cb-9186-923da969802a/ifca_a_12325954_f0001.jpg)
Table 1. Patient demographics, characteristics and baseline comorbidities.
(A) Elevated TG cohort and comparator. (B) High-TG cohort and comparator.
†Population used for patient characteristics and other analyses.
‡Population used for multivariate analyses.
HDL-C: High-density lipoprotein cholesterol; TG: Triglycerides.
Reproduced with permission from [Citation21].
![Figure 2. Identification of cohorts used for analyses. (A) Elevated TG cohort and comparator. (B) High-TG cohort and comparator. †Population used for patient characteristics and other analyses. ‡Population used for multivariate analyses.HDL-C: High-density lipoprotein cholesterol; TG: Triglycerides.Reproduced with permission from [Citation21].](/cms/asset/0aca07bd-7e4d-476c-99d6-227d2e24f8a5/ifca_a_12325954_f0002.jpg)
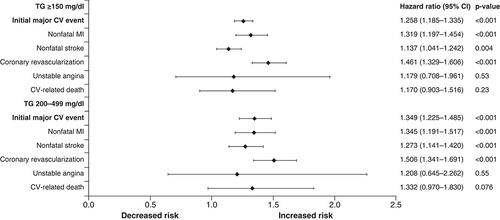
Covariates included TG cohort, age, sex, insurance coverage type, geographic region of enrollment, baseline clinical characteristics and baseline medication use. The composite end point included nonfatal MI, nonfatal stroke, coronary revascularization, unstable angina and CV-related death during the follow-up period.
CV: Cardiovascular; MI: Myocardial infarction; TG: Triglyceride.
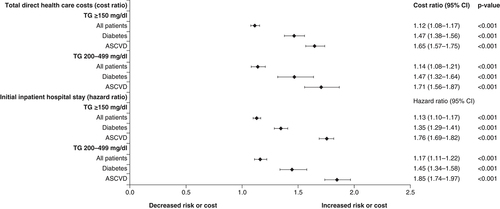
Covariates included TG cohort, age, sex, insurance coverage type, geographic region of enrollment, baseline clinical characteristics and baseline medication use. The composite end point included nonfatal myocardial infarction, nonfatal stroke, coronary revascularization, unstable angina and cardiovascular-related death during the follow-up period. The cost ratio is the relative healthcare cost in one group versus another.
ASCVD: Atherosclerotic cardiovascular disease; TG: Triglyceride.
(A) Cumulative incidence of cardiovascular events in REDUCE-IT. Kaplan–Meier event curves for the primary efficacy composite end point of CV death, nonfatal MI, nonfatal stroke, coronary revascularization, or unstable angina in the icosapent ethyl group and the placebo group, in a time-to-event analysis of the REDUCE-IT study. (B) Distribution of first and subsequent primary composite events in the reduced dataset for patients randomized 1:1 to icosapent ethyl versus placebo in REDUCE-IT. HRs and 95% CIs for between-treatment group comparisons were generated using Li-Lagakos-modified Wei-Lin-Weissfeld method for the first, second and third event categories. RR and 95% CI for between-group comparisons used a negative binomial model for additional events beyond first, second and third occurrences (i.e., fourth event or more) and overall treatment comparison. Analyses are based on a reduced dataset accounting for statistical handling of multiple end points occurring in a single calendar day by counting as a single event.
CV: Cardiovascular; HR: Hazard ratio; MI: Myocardial infarction; RR: Rate ratio.
(A) Reprinted with permission from [Citation16] © Massachusetts Medical Society (2019).
(B) Reproduced with permission from [Citation37].
![Figure 5. REDUCE-IT results. (A) Cumulative incidence of cardiovascular events in REDUCE-IT. Kaplan–Meier event curves for the primary efficacy composite end point of CV death, nonfatal MI, nonfatal stroke, coronary revascularization, or unstable angina in the icosapent ethyl group and the placebo group, in a time-to-event analysis of the REDUCE-IT study. (B) Distribution of first and subsequent primary composite events in the reduced dataset for patients randomized 1:1 to icosapent ethyl versus placebo in REDUCE-IT. HRs and 95% CIs for between-treatment group comparisons were generated using Li-Lagakos-modified Wei-Lin-Weissfeld method for the first, second and third event categories. RR and 95% CI for between-group comparisons used a negative binomial model for additional events beyond first, second and third occurrences (i.e., fourth event or more) and overall treatment comparison. Analyses are based on a reduced dataset accounting for statistical handling of multiple end points occurring in a single calendar day by counting as a single event.CV: Cardiovascular; HR: Hazard ratio; MI: Myocardial infarction; RR: Rate ratio. (A) Reprinted with permission from [Citation16] © Massachusetts Medical Society (2019). (B) Reproduced with permission from [Citation37].](/cms/asset/eb651e87-d9d4-425d-b00e-99a2f5c8d4e8/ifca_a_12325954_f0005.jpg)