Figures & data
Table 1. Baseline characteristics of the patients with sepsis.
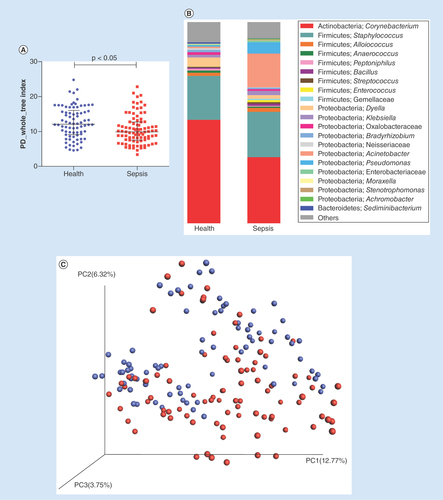
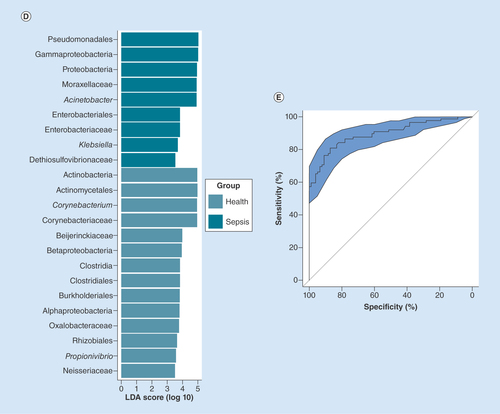
(A) α diversity between the septic patients and healthy subjects. (B) Stacked bar chart of bacteria at the genus level between the septic patients and healthy controls.(C)Principal coordinate analysis based on unweighted UniFrac distances. The red dots represent patients with sepsis, and the blue dots represent the controls. (D) significantly different taxa between the healthy participants and septic patients were determined using the linear discriminant analysis effect size (LEfSe). The data show increasing levels of Gammaproteobacteria, Pseudomonadales, Proteobacteria, Pseudomonas, Moraxellaceae, Acinetobacter, Enterobacteriaceae and Klebsiella in the patients. (E) Machine-learning classification based on nasal microbiota using random forest algorithms.
LDA: Linear discriminant analysis.
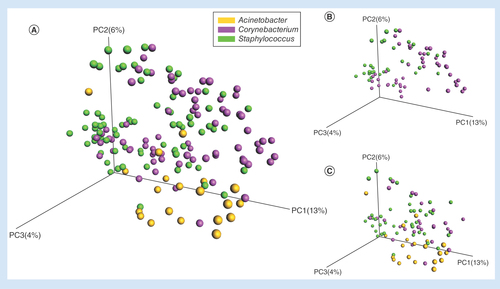
(A) Principal coordinate analysis (PCoA) of septic patients and healthy subjects based on unweighted UniFrac distances. (B) PCoA of healthy subjects based on unweighted UniFrac distances. (C) PCoA of patients with sepsis based on unweighted UniFrac distances. The orange circles represent the samples (nasal microbiota) with the Acinetobacter type, the purple circles represent the samples with the Corynebacterium type and the green circles represent the samples with the Staphylococcus type.
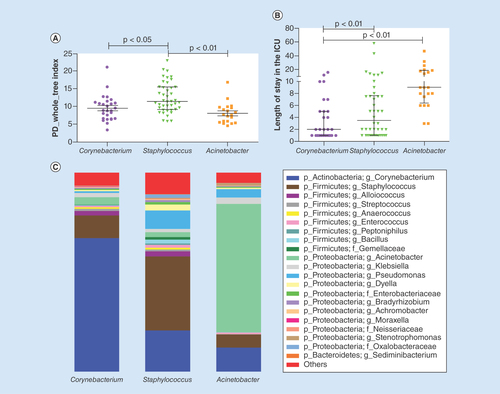
(A) Comparison of the α diversity among the three nasal bacterial types in patients with sepsis. (B) Comparison of the length of intensive care unit stay among the three nasal bacterial types in patients with sepsis. (C) Comparison of the stacked bar charts of the genera in the three nasal bacterial types in patients with sepsis.
ICU: Intensive care unit; PD: Phylogenetic diversity.
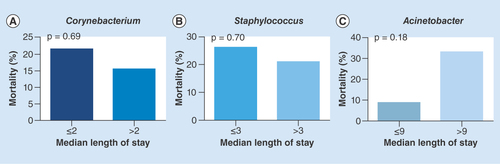
(A) Mortality of the Corynebacterium type based on different lengths of intensive care unit (ICU) stay. (B) Mortality of the Staphylococcus type based on different lengths of ICU stay. (C) Mortality of the Acinetobacter type based on different lengths of ICU stay.