Figures & data
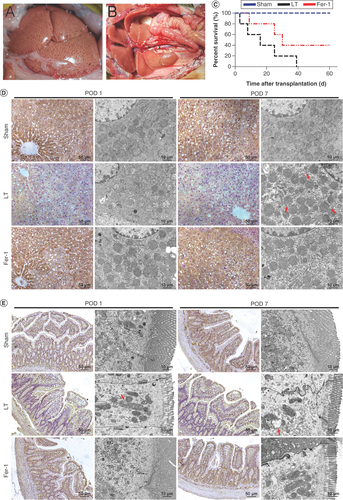
(A) Severe steatotic liver grafts. (B) Liver transplantation with severe steatotic liver grafts. (C) Survival time after steatotic liver transplantation. (D) Immunohistochemistry of liver tissue GPX4 (×200) and electron microscopy showing ferroptosis in severe steatotic liver grafts after transplantation. The red arrow indicates mitochondrial outer membrane rupture. (E) Immunohistochemistry of intestinal tissue GPX4 (×200) and electron microscopy showing iron death in intestinal tissue after transplantation. The red arrow indicates mitochondrial outer membrane rupture.
POD 1: Postoperative day 1; POD 7: Postoperative day 7.
(A) Histopathology of severe steatotic transplanted liver (hematoxylin and eosin [H&E] staining, ×200). (B) Liver function. (C) Recipient intestinal histopathology (H&E staining, ×200). (D) Intestinal permeability of recipients.
ALP: Alkaline phosphatase; ALT: Alanine aminotransferase; AST: Aspartate aminotransferase; DAO: Diamine oxidase; D-LA: D-lactic acid; HDL: High-density lipoprotein; LDL: Low-density lipoprotein; LPS: Lipopolysaccharide; POD 1: Postoperative day 1; POD 7: Postoperative day 7; TBil: Total bilirubin; TC: Total cholesterol; VLDL: Very low-density lipoprotein.
![Figure 2. Histological and functional changes in transplanted liver and recipient intestines. (A) Histopathology of severe steatotic transplanted liver (hematoxylin and eosin [H&E] staining, ×200). (B) Liver function. (C) Recipient intestinal histopathology (H&E staining, ×200). (D) Intestinal permeability of recipients.ALP: Alkaline phosphatase; ALT: Alanine aminotransferase; AST: Aspartate aminotransferase; DAO: Diamine oxidase; D-LA: D-lactic acid; HDL: High-density lipoprotein; LDL: Low-density lipoprotein; LPS: Lipopolysaccharide; POD 1: Postoperative day 1; POD 7: Postoperative day 7; TBil: Total bilirubin; TC: Total cholesterol; VLDL: Very low-density lipoprotein.](/cms/asset/a2970157-67dc-4c87-8f6b-3481455c5af9/ifmb_a_12367163_f0002.jpg)
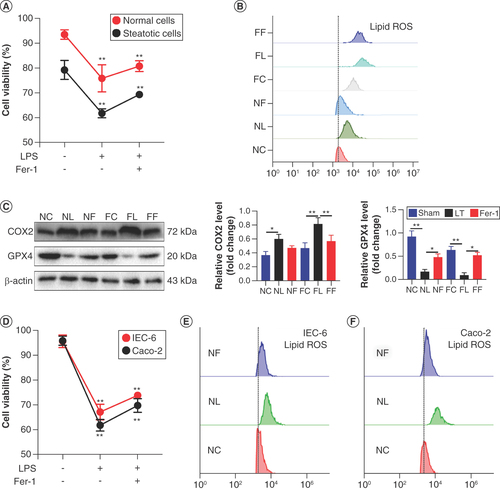
(A) Normal and steatosis IAR20 cell activity. (B) Lipid reactive oxygen species (ROS) content in normal and steatosis IAR20 cells. (C) Expression of COX2 and GPX4 in normal and steatosis IAR20 cells. (D) Intestinal epithelial cell activity in each group. (E) Lipid ROS content in IEC-6 cells. (F) Lipid ROS content in Caco-2 cells.
*p < 0.05; **p < 0.01.
FC: Adipose degeneration IAR20 cells; FF: 10 μg/ml LPS plus 2 μM Fer-1; FL: 10 μg/ml LPS to stimulate adipose degeneration IAR20 cells for 24 h; LPS: Lipopolysaccharide; NC: Normal IAR20 cells; NF: 10 μg/ml LPS plus 2 μM Fer-1; NL: 10 μg/ml LPS to stimulate normal IAR20 cells for 24 h.
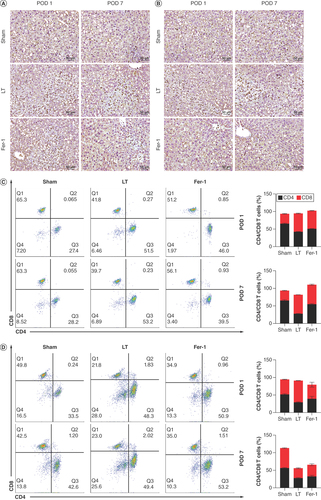
(A) Myeloperoxidase immunohistochemistry of liver tissue (×200). (B) Immunohistochemistry of liver tissue CD68 (×200). (C) Flow cytometry of blood T-cell subsets. (D) Flow cytometry of T-cell subsets in liver grafts.
POD 1: Postoperative day 1; POD 7: Postoperative day 7.
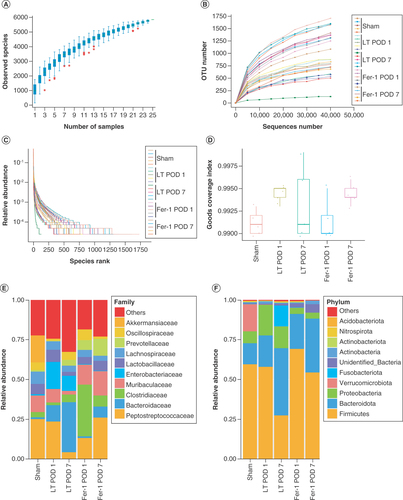
(A) Species accumulation boxplot. The flat position of this box chart indicates that species in this environment will not significantly increase with increasing sample size, hence sampling was sufficient for data analysis. (B) Rarefaction curve. (C) Rank abundance curve. (D) Good coverage index reflecting adequate sequencing depth. (E) Species abundance at the family level. (F) Species abundance at the phylum level.
POD 1: Postoperative day 1; POD 7: Postoperative day 7.
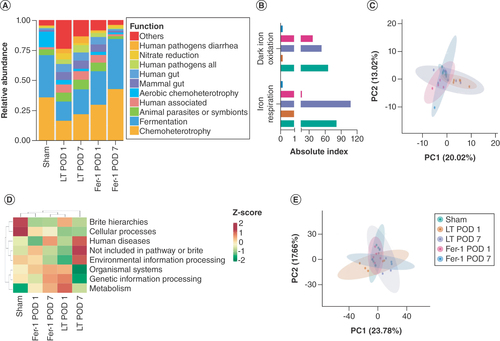
(A) FAPROTAX function prediction. (B) FAPROTAX function prediction related to iron metabolism. (C) Annotated Principal Component Analysis (PCA) results based on operational taxonomic unit (OTU) FAPROTAX function. (D) OTU-based clustering heatmap for each group of PICRUST functional annotations. (E) Annotated PCA results based on OTU PICRUST function.