Figures & data
Mice were implanted intraperitoneally with ID8 cells to induce peritoneal carcinomatosis and ascites formation. After 32 days, mice were administered pmIL-12/PPC intraperitoneally at a dose of 250 μg (DNA). Ascites was collected 1, 2, 3, and 7 days post administration, and protein levels were determined by ELISA. Values are expressed as mean ± standard deviation and normalized to total amount of ascites fluid. (A) mIL-12 expression. (B) Murine IFN-γ expression. (C) VEGF expression.
Reproduced with permission from [Citation42] © John Wiley and Sons, Inc. (2009); permission conveyed through Copyright Clearance Center, Inc.
![Figure 3. Protein expression levels after pmIL-12/PPC intraperitoneal administration to mice with disseminated ovarian cancer.Mice were implanted intraperitoneally with ID8 cells to induce peritoneal carcinomatosis and ascites formation. After 32 days, mice were administered pmIL-12/PPC intraperitoneally at a dose of 250 μg (DNA). Ascites was collected 1, 2, 3, and 7 days post administration, and protein levels were determined by ELISA. Values are expressed as mean ± standard deviation and normalized to total amount of ascites fluid. (A) mIL-12 expression. (B) Murine IFN-γ expression. (C) VEGF expression.Reproduced with permission from [Citation42] © John Wiley and Sons, Inc. (2009); permission conveyed through Copyright Clearance Center, Inc.](/cms/asset/6a96f28d-6435-49ab-933d-d67708c462a0/ifon_a_12332476_f0003.jpg)
Animals were given 4 weekly pmIL-12/PPC intraperitoneal administrations starting 20 days after tumor implant. Dosages were adjusted by changes in DNA concentration of the formulation using a fixed injection volume. (A) Comparison of animal weights at 42 days after tumor implant. Values are expressed as mean ± standard deviation with n = 5 for each point. (B) Kaplan–Meier survival curves for various treatment groups (n = 5 for each group).
Reproduced with permission from [Citation42] © John Wiley and Sons, Inc. (2009); permission conveyed through Copyright Clearance Center, Inc.
![Figure 4. Efficacy outcomes of untreated tumor-bearing mice versus pmIL-12/PPC-treated mice.Animals were given 4 weekly pmIL-12/PPC intraperitoneal administrations starting 20 days after tumor implant. Dosages were adjusted by changes in DNA concentration of the formulation using a fixed injection volume. (A) Comparison of animal weights at 42 days after tumor implant. Values are expressed as mean ± standard deviation with n = 5 for each point. (B) Kaplan–Meier survival curves for various treatment groups (n = 5 for each group).Reproduced with permission from [Citation42] © John Wiley and Sons, Inc. (2009); permission conveyed through Copyright Clearance Center, Inc.](/cms/asset/c86f7824-b773-47bd-8877-efef542acacc/ifon_a_12332476_f0004.jpg)
Mice were administered intraperitoneally ID8 cells. Animal weights and survival analysis of animals given combination treatment of pmIL-12/PPC with a paclitaxel/carboplatin treatment regimen consisting of carboplatin 30 mg/kg (bodyweight) and paclitaxel (6 mg/kg) given iv. (this treatment regimen has been previously evaluated in the ID8 tumor model and shown to produce therapeutic efficacy without overt toxicity). Treatments started 14 days after tumor implant. The pmIL-12/PPC was administered at a total dose of 100 μg per treatment starting 18 days after tumor implant. (A) Comparison of animal weights across cohorts over time. (B) Survival of animals across cohorts. Significance between each cohort was determined by the Gehan–Breslow nonparametric analysis of variance (n = 10 for each cohort).
Reproduced with permission from [Citation42] © John Wiley and Sons, Inc. (2009); permission conveyed through Copyright Clearance Center, Inc.
![Figure 5. Efficacy outcomes of untreated tumor-bearing mice versus pmIL-12/PPC- and/or chemotherapy-treated mice.Mice were administered intraperitoneally ID8 cells. Animal weights and survival analysis of animals given combination treatment of pmIL-12/PPC with a paclitaxel/carboplatin treatment regimen consisting of carboplatin 30 mg/kg (bodyweight) and paclitaxel (6 mg/kg) given iv. (this treatment regimen has been previously evaluated in the ID8 tumor model and shown to produce therapeutic efficacy without overt toxicity). Treatments started 14 days after tumor implant. The pmIL-12/PPC was administered at a total dose of 100 μg per treatment starting 18 days after tumor implant. (A) Comparison of animal weights across cohorts over time. (B) Survival of animals across cohorts. Significance between each cohort was determined by the Gehan–Breslow nonparametric analysis of variance (n = 10 for each cohort).Reproduced with permission from [Citation42] © John Wiley and Sons, Inc. (2009); permission conveyed through Copyright Clearance Center, Inc.](/cms/asset/8599c899-6934-4366-86e7-72c96fec1d28/ifon_a_12332476_f0005.jpg)
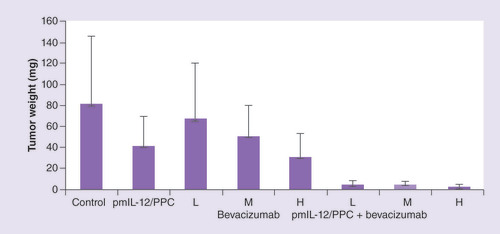
Comparison of tumor weights in peritoneally disseminated SKOV3 human cancer-bearing immunocompromised mice. To induce tumor formation, mice were administered intraperitoneally 7 × 10⁶ SKOV-3 cells. Treatments consisted of pmIL-12/PPC at 100 μg DNA dose, bevacizumab at low (5 mg/kg), medium (10 mg/kg) or high (20 mg/kg) dose, or a combination thereof. Treatments were started 10 days after tumor implant and were given weekly for 4 weeks (pmIL-12/PPC) or 6 weeks (bevacizumab). At 59 days after tumor implant, the animals were euthanized and all visible tumors from the peritoneal cavity and abdominal organs were collected and weighed. The values are presented as mean ± standard error of the mean (n = 6 for each group).
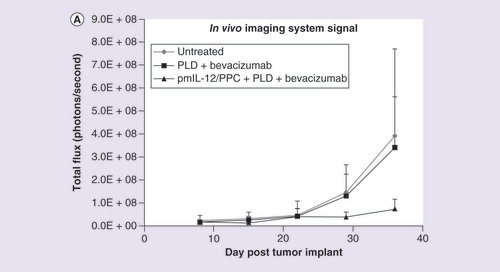
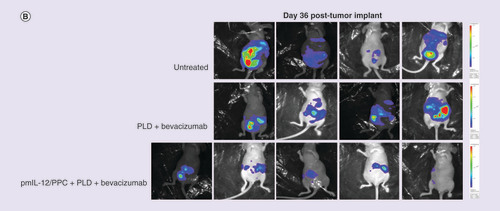
(A) Quantified levels of luciferase bioluminescence using an in vivo imaging system in immunocompromised mice injected with SKOV3 human ovarian cancer cell line (7 × 10⁶ cells) constitutively expressing the luciferase gene. Mice were treated with pegylated liposomal doxorubicin (7.5 mg/kg; two treatments once every 3 weeks) plus bevacizumab (10 mg/kg; five treatments administered weekly) or pegylated liposomal doxorubicin plus bevacizumab plus pmIL-12/PPC (100 mg; four treatments administered weekly). (B) Photographic montage showing the relative luciferase levels in mice with peritoneally disseminated SKOV3 human cancer 36 days after tumor inoculation.
PLD: Pegylated liposomal doxorubicin.