
Figures & data
Table 1. Baseline demographics and clinical characteristics.
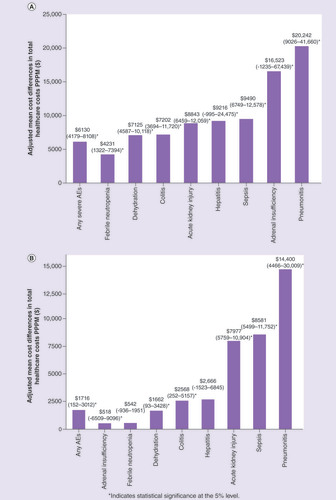
(A) Adjusted mean cost differences (and 95% CIs) comparing patients with versus without select severe AEs. (B) Adjusted mean cost differences (and 95% CIs) comparing patients with versus without select AEs of any severity.
*Indicates statistical significance at the 5% level.
AE: Adverse event; CI: Confidence interval; PPPM: Per-patient-per-month.
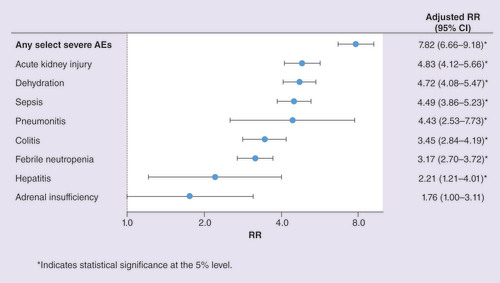
*Indicates statistical significance at the 5% level.
AE: Adverse event; CI: Confidence interval; RR: Rate ratio.
Supplemental material