
Figures & data
Table 1. Study demographics and clinicopathologic information according to menaopausal stage.
(A) (left): premenopausal, (B) (middle): post-menopausal, (C) (right): pre-menopausal, stage I/II invasive cancer and benign adnexal masses only. Training set: OVA1 Study, Validation sets: OVA500 Study, FHCRC #7788 and OVA1-PS1-CO4.
AMRA: Adnexal mass risk assessment; AUC: Area under curve; ROC: Receiver operating characteristic.
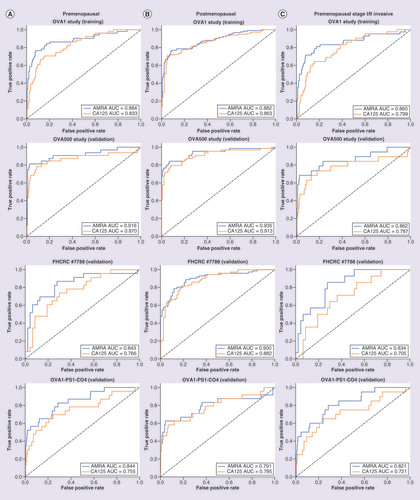
Figure 3A (top): premenopausal, Figure 3B (bottom): postmenopausal. Left: training set (OVA1 Study), Right: combined validation Sets (OVA500 Study, FHCRC #7788 and OVA1-PS1-CO4). Exact numbers are listed under ‘Estimates Adjusted for Assumed Pretest Prevalence’ in &.
AMRA: Adnexal mass risk assessment; HR: High risk; IR: Intermediate risk; LR: Lower risk.
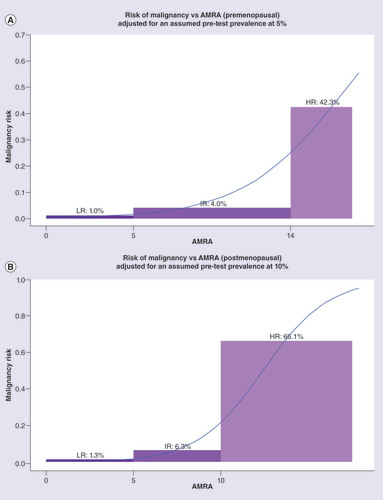
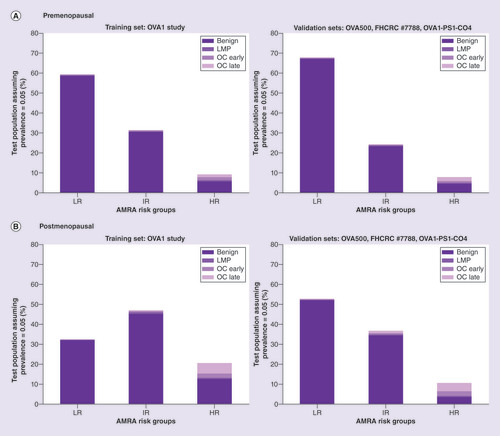
Table 2. Distribution of benign, low-malignant potential tumor/early stage, late stage cancer in premenopausal adnexal mass risk assessment risk groups (actual and projected based on assumed prevalence).
Table 3. Distribution of benign, low-malignant potential tumor/early stage, late stage cancer in postmenopausal adnexal mass risk assessment risk groups (actual and projected based on assumed prevalence).
Table 4. Estimated performance metrics of adnexal mass risk assessment risk groups.
The estimated cancer probability bars were superimposed with an interpolation curve by logistic regression.
Data sharing statement
The authors certify that this manuscript reports the secondary analysis of clinical trial data that have been shared with them, and that the use of this shared data is in accordance with the terms (if any) agreed upon their receipt. The source of this data is: OVA1-001-CO1, OVA1-001-CO3, OVA1-7788, OVA1-PS1-CO4. As the data are proprietary, no individual clinical trial data will be shared other than the statistical summaries already available.