Figures & data
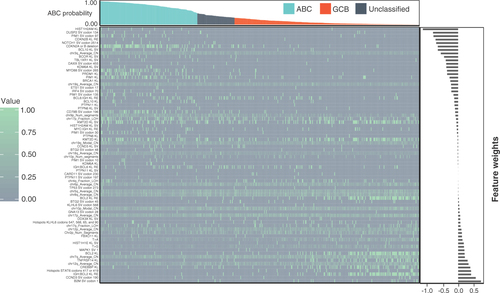
Heatmap indicating the score for each nonzero feature for each sample. For binary features, a value of 1 (green) indicates presence while a value of 0 (grey) indicates absence. For continuous features, values are normalized within each feature so the maximum value is set to 1 and minimum to 0. Bar graph at top indicates ABC probability score assigned to sample from the cell-of-origin DNA classifier, with colors indicating cutoff for ABC (blue), unclassified (grey) and GCB (orange). Bar graph on right indicates the weight value for each nonzero feature.
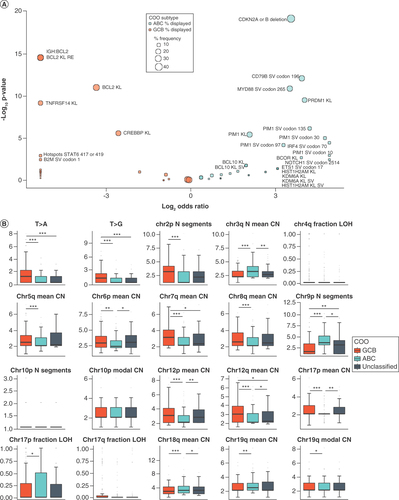
KL: Known or likely pathogenic; RE: Rearrangement; SV: Short variant.
Enrichment was assessed using NanoString-assessed cell of origin. (A) Enrichment for all binary features with nonzero weights in the model. Enrichment in ABC is indicated by blue dots (Log2 odds ratio >0), and enrichment in GCB is indicated by orange dots (Log2 odds ratio <0). Size of dot indicates the frequency of the feature in the enriched group. Labels indicate features with significant enrichment (p < 0.05). (B) Enrichment for continuous features with nonzero weights in the model. Horizontal line in each box represents the median of the feature while lower and upper bounds of the box represent 25th percentile and 75th percentile, respectively. Whiskers extend to extreme values no more than 1.5-times the interquartile range beyond the box. Points beyond whiskers are considered outliers and are plotted individually. N Segments indicates number of segments. T>A and T>G indicate a point mutation from T to A or G. *p < 0.05; **p < 0.01; ***p < 0.001.
ns: Not significant.
(A) Pie graphs showing the overall breakdown of COO for all GOYA samples as determined by NanoString or COODC. (B) Pie graphs showing the breakdown of COODC COO calls within each NanoString COO group. Survival curves indicating progression-free survival for (C) COODC-determined COO groups from (C) GOYA validation and (D) MAIN validation and (E) COODC-determined COO compared with NanoString determined COO.
COO: Cell of origin; COODC: Cell-of-origin DNA classifier.
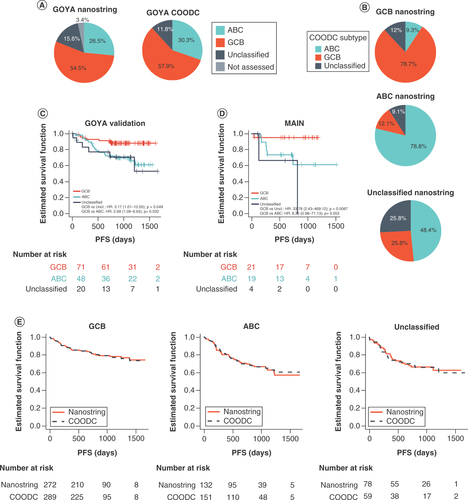
Table 1. ConcordanceTable Footnote† (count) of cell-of-origin DNA classifier algorithm with NanoString cell-of-origin calls.
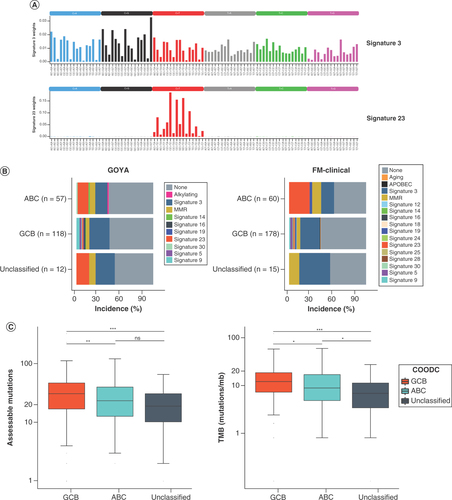
(A) Plots of trinucleotide context for signatures 3 (top) and 23 (bottom). (B) Frequency of mutational signatures by cell-of-origin DNA classifier type in GOYA (left) and FM-clinical (right). Only samples with ≥20 assessable mutations were included. If no dominant signature (no signature with >0.4 score) was detected, signature is reported as none. (C) Box and whisker of all alterations assessed for trinucleotide context (left) and for tumor mutational burden (right) in GOYA indicating median by the horizontal line while lower and upper bounds of the box represent 25th percentile and 75th percentile, respectively. Whiskers extend to extreme values no more than 1.5-times the interquartile range beyond the box. Points beyond whiskers are considered outliers and are plotted individually. *p < 0.05; **p < 0.01; ***p < 0.001.
ns: Not significant.