Figures & data
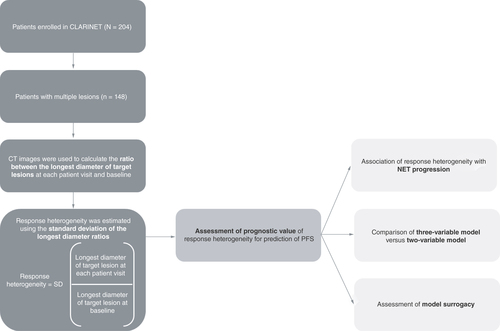
A Cox regression analysis assessed the association of response heterogeneity with NET progression at each patient visit at weeks 12, 24, 36, 48 and 72. Cox models were also trained on patient samples of available data at patient visits (week 12: n = 148; week 24: n = 131; week 36: n = 108; week 48: n = 90; week 72: n = 70). A three-variable model (combining the response heterogeneity output with the SLDr and change in logCgA between each patient visit and baseline), was compared with a two-variable model (based on SLDr and change in logCgA between each patient visit and baseline only), and a model based on SLDr alone for the prediction of PFS at patient visits at weeks 12, 24, 36, 48 and 72. The surrogacy of the models, as measured by the proportion explained metric, was also compared at patient visits at weeks 12, 24, 36, 48 and 72.
CgA: Chromogranin A; NET: Neuroendocrine tumor; PFS: Progression-free survival; SD: Standard deviation; SLDr: Sum of longest diameter ratio.
(A) CT scans of lesions demonstrating low response heterogeneity at baseline and week 12. The response heterogeneity value, calculated as the SD of the LDr of the target lesions, was 0.01 for this patient. (B) CT scans of lesions demonstrating high response heterogeneity at baseline and week 12. The response heterogeneity value was 0.11 for this patient.
CT: Computerized tomography; LDr: Longest diameter ratio; SD: Standard deviation.
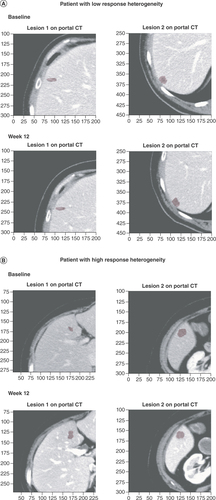
Table 1. Baseline demographics and patient disease characteristics for the patients in the RAISE response heterogeneity analysis.
Table 2. Response heterogeneity and NET progression at patient visits over 72 weeks in the subset of patients with multiple lesions enrolled in CLARINET.
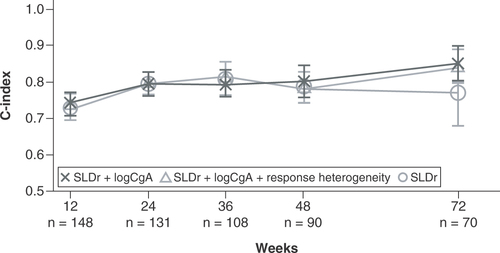
C-index values are reported for the prediction of PFS in the subset of patients with multiple lesions enrolled in CLARINET at patient visits at weeks 12, 24, 36, 48 and 72 for the entire subset. The figure shows the comparison between the three-variable model (incorporating response heterogeneity with SLDr and change from baseline in logCgA), the two-variable model (combining SLDr and change from baseline in logCgA) and SLDr alone.
CgA: Chromogranin A; PFS: Progression-free survival; SLDr: Sum of longest diameter ratio.
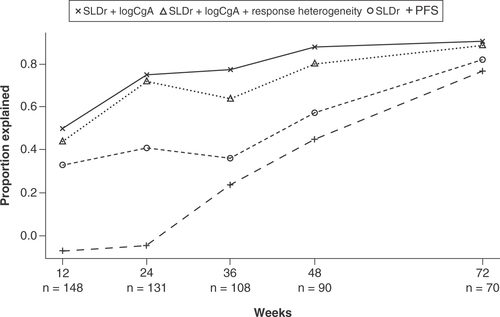
Surrogacy of the models was evaluated by the proportion explained metric. This metric quantifies the proportion of treatment effect on PFS that could be accounted for by the variables included in the models (SLDr, change from baseline in logCgA, response heterogeneity) and SLDr and PFS alone at earlier timepoints. The figure shows surrogacy of the three-variable model (incorporating response heterogeneity with SLDr and change from baseline in logCgA), the two-variable model (combining SLDr and change from baseline in logCgA), and SLDr and PFS alone at patient visits at weeks 12, 24, 36, 48 and 72.
CgA: Chromogranin A; PFS: Progression-free survival; SLDr: Sum of longest diameter ratio.