Figures & data
Table 1. Patient characteristics.
EU4: France, Germany, Italy, Spain.
Table 2. Use of novel agents in first-line acute myeloid leukemia patients by type of regimen.
Table 3. Novel agents in combination administered in first-line treatment acute myeloid leukemia patients.
Table 4. Use of novel agents across time.
Table 5. Different treatments combination with novel agents across time.
Table 6. Treatment response.
LOT: Line of treatment.
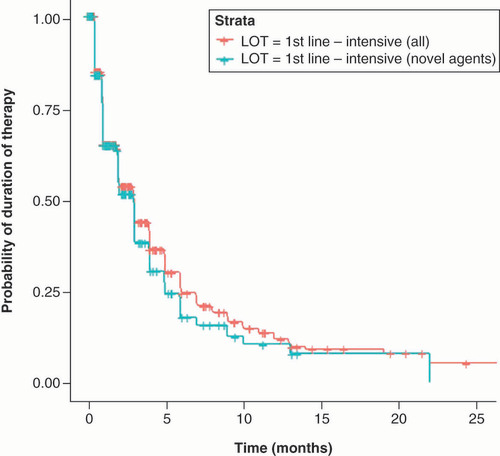
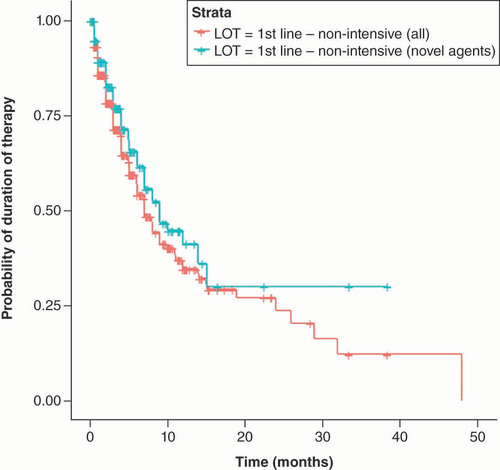
Table 7. Probability of still being treated across time in newly diagnosed acute myeloid leukemia patients receiving intensive regimens.
LOT: Line of treatment.