990
Views
0
CrossRef citations to date
0
Altmetric
Meta-Analysis

Clinical outcomes for previously treated patients with advanced biliary tract cancer: a meta-analysis

, , , , , , , & ORCID Icon show all
Pages 863-876 | Received 03 Jan 2023, Accepted 30 Jan 2024, Published online: 14 Feb 2024

Figures & data

Table 1. PICOST eligibility criteria for the systematic review.

Figure 1. PRISMA flow diagram.

Flow diagram depicting the study search and selection processes.

Figure 1. PRISMA flow diagram. Flow diagram depicting the study search and selection processes.

Table 2. General characteristics of studies included in the systematic review.
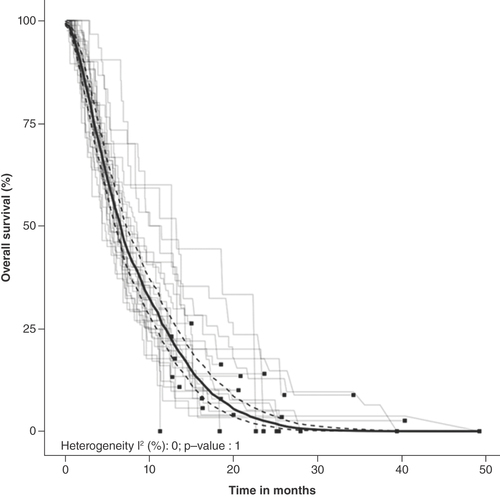
Figure 2. Funnel plot for the assessment of publication bias.

A funnel plot of the 34 trial arms included in the meta-analysis of objective response rate was symmetrical. An accompanying Egger’s test showed no evidence of publication bias (intercept: 0.43; 95% CI: -1.57 to 2.44; p = 0.67).

Figure 2. Funnel plot for the assessment of publication bias. A funnel plot of the 34 trial arms included in the meta-analysis of objective response rate was symmetrical. An accompanying Egger’s test showed no evidence of publication bias (intercept: 0.43; 95% CI: -1.57 to 2.44; p = 0.67).
Figure 3. Meta-analysis of objective response rate.

‘Responders’ denotes the number of patients with an objective response (complete response + partial response). ‘Total’ denotes the number of patients who received at least one dose of treatment.

OR: Objective response.

Figure 3. Meta-analysis of objective response rate. ‘Responders’ denotes the number of patients with an objective response (complete response + partial response). ‘Total’ denotes the number of patients who received at least one dose of treatment.OR: Objective response.
Figure 4. Meta-analysis of overall survival.

Grey lines represent Kaplan–Meier estimates of overall survival for each trial arm. Black squares represent the end of follow-up for each trial. The thick black line represents the random effects pooled overall survival estimate with 95% CI (dashed lines). The p-value was derived from Cochran’s Q test of heterogeneity (I2 test statistic).

Figure 4. Meta-analysis of overall survival. Grey lines represent Kaplan–Meier estimates of overall survival for each trial arm. Black squares represent the end of follow-up for each trial. The thick black line represents the random effects pooled overall survival estimate with 95% CI (dashed lines). The p-value was derived from Cochran’s Q test of heterogeneity (I2 test statistic).

Table 3. 
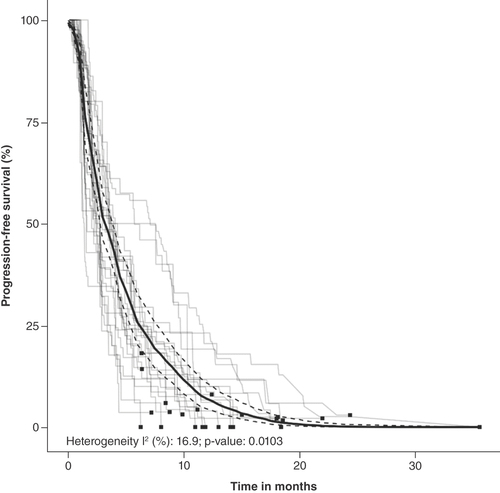
Summary of pooled Kaplan–Meier estimates of overall survival and progression-free survival.

Figure 5. Meta-analysis of progression-free survival.

Grey lines represent Kaplan–Meier estimates of progression-free survival for each trial arm. Black squares represent the end of follow-up for each trial. The thick black line represents the random effects pooled progression-free survival estimate with 95% CI (dashed lines). The p-value was derived from Cochran’s Q test of heterogeneity (I2 test statistic).

Figure 5. Meta-analysis of progression-free survival. Grey lines represent Kaplan–Meier estimates of progression-free survival for each trial arm. Black squares represent the end of follow-up for each trial. The thick black line represents the random effects pooled progression-free survival estimate with 95% CI (dashed lines). The p-value was derived from Cochran’s Q test of heterogeneity (I2 test statistic).
Supplemental material

Supplementary document

Download MS Word (294 KB)