Figures & data
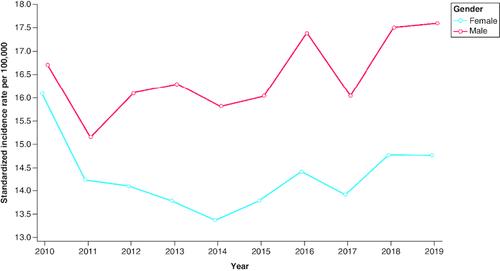
Figure 1. Patient disposition.
CRC: Colorectal cancer; mCRC: Metastatic colorectal cancer.
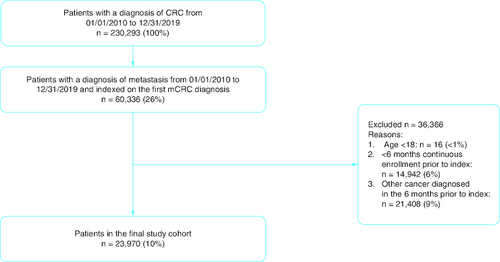
Table 1. Demographic and clinical characteristics.
Table 2. Crude and standardized incidence rates of metastatic colorectal cancer by age group from 2010 to 2019.
Figure 2. Standardized incidence rates (per 100,000) and annual percentage change for metastatic colorectal cancer by age group from 2010 to 2019.
APC: Annual percentage change.
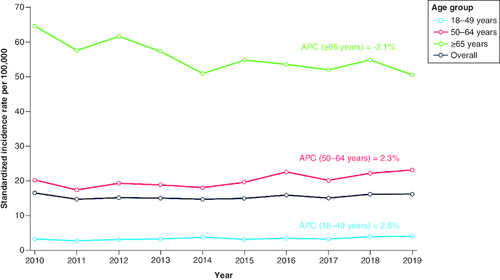
Table 3. Crude and standardized incidence rates of metastatic colorectal cancer by sex from 2010 to 2019.
Figure 3. Standardized incidence rates (per 100,000) for metastatic colorectal cancer by sex from 2010 to 2019.
Standard US population is based on the 2010 census. Patients with unknown sex were excluded from the denominator population.