
Figures & data
1L: First-line; 2L: Second-line.
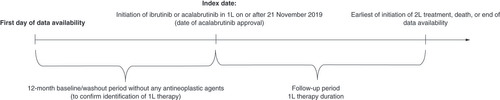
1The beginning of data availability is 01/01/2016. The end of data availability is the earlier of date of death or 04/30/2022. For patients without a date of death, 04/30/2022 is used as the end of data availability.
2ICD-10 CM code; N18.6.
3ICD-10 CM codes: C81-C82, C83.1-C83.7, C84, C85.2, C86, C88, C90, C91.0, C91.2-C91.6, C91.A, C92-C93, C94.0-C94.4, C95.0 and C96.
4Patients may use both acalabrutinib and ibrutinib. As such, the cohorts are not mutually exclusive at this step of the patient selection.
1L: First-line; CLL/SLL: Chronic lymphocytic leukemia/small lymphocytic lymphoma; ICD-10 CM: International Classification of Diseases, Tenth Revision, Clinical Modification.
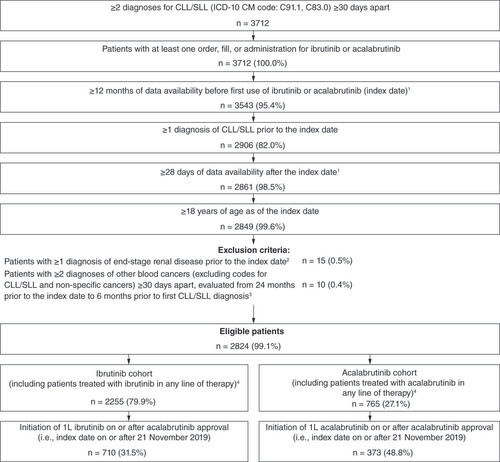
Table 1. Baseline characteristics evaluated during the 12-month baseline period.
Table 2. Treatment regimen received following 1L ibrutinib or acalabrutinib.
*Indicates p-value < 0.05.
1L: First-line; HR: Hazard ratio; Pts: Patients; TTNT: Time to next treatment.
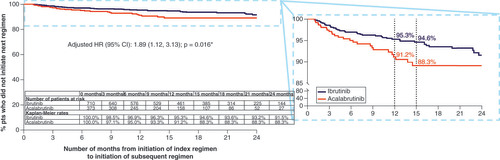
Table 3. Sensitivity analyses for the comparison of TTNT between 1L ibrutinib and 1L acalabrutinibTable Footnote † .
Supplemental Figure 1
Download PDF (10.2 MB)Data Sharing Statement
The data that support the findings of this study are available from Acentrus, but restrictions apply to the availability of these data, which were used pursuant to a data use agreement. The data are available through requests made directly to Acentrus, subject to Acentrus’s requirements for data access.