Figures & data
Table 1. Age-wise distribution of viral infections with clinical manifestation of the study patients and positive percentage.
Table 2. Distribution of viral etiological agents among different age groups and gender.
Table 3. Distribution of viral etiological agents and coinfections.
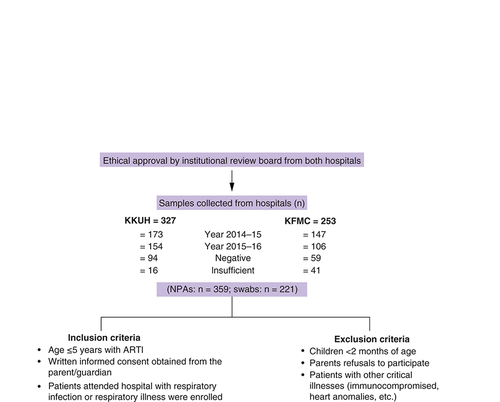
ARTI: Acute respiratory tract infections; KFMC: King Fahad Medical City KKUH: King Khalid University Hospital; NPAs: Nasopharyngeal aspirates.
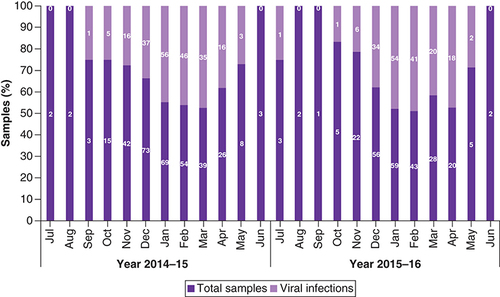
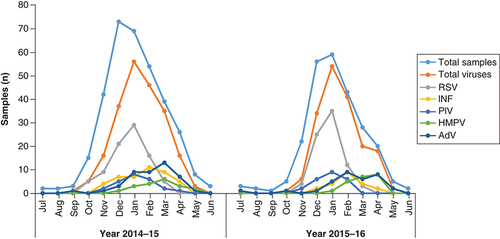
Total sample collected from both the hospitals. Total viruses refers to the total number of viruses detected in samples and counted twice for double viral infections.
AdV: Adenovirus; HMPV: Human metapneumovirus; INF: Influenza; PIV: Parainfluenza virus; RSV: Respiratory syncytial virus.