
Figures & data
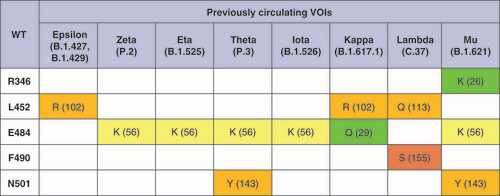
Grantham’s distances [Citation16] for the corresponding pairs of amino acids are given in parentheses. Distances 0–50 are considered as a conservative substitution (green), 51-100 as moderately conservative (yellow), 101-150 as moderately radical (orange), or ≥151 as radical (red) according to the described classification [Citation17].
VOC: Variant of concern; WT: Wild-type.
![Figure 1. Mutations in the receptor-binding domains of the variants of concern.Grantham’s distances [Citation16] for the corresponding pairs of amino acids are given in parentheses. Distances 0–50 are considered as a conservative substitution (green), 51-100 as moderately conservative (yellow), 101-150 as moderately radical (orange), or ≥151 as radical (red) according to the described classification [Citation17].VOC: Variant of concern; WT: Wild-type.](/cms/asset/76bf06d6-5e73-45af-8774-25dd6ae66528/ifvl_a_12336087_f0001.jpg)
VOI: Variant of interest; WT: Wild-type.
Evaluation of the functional impact of mutations is presented according to the criteria of the developers of each of the methods: 1) SIFT: score <0.05 - ‘deleterious’; score ≥0.05 - ‘tolerated’ [Citation18]; 2) PROVEAN: score ≤-2.5 - ‘deleterious’, score >2.5 - ‘neutral’ [Citation19]; 3) SNAP2: score ≤0 - ‘neutral’, score >0 - ‘effect’ [Citation20]. Green indicates tolerated/neutral mutations; red indicates deleterious/effect mutations.
WT: Wild-type.
![Figure 3. Prediction of the functional effects of mutations in the RBD of the SARS-CoV-2.Evaluation of the functional impact of mutations is presented according to the criteria of the developers of each of the methods: 1) SIFT: score <0.05 - ‘deleterious’; score ≥0.05 - ‘tolerated’ [Citation18]; 2) PROVEAN: score ≤-2.5 - ‘deleterious’, score >2.5 - ‘neutral’ [Citation19]; 3) SNAP2: score ≤0 - ‘neutral’, score >0 - ‘effect’ [Citation20]. Green indicates tolerated/neutral mutations; red indicates deleterious/effect mutations.WT: Wild-type.](/cms/asset/40bc3370-ed04-4f69-ab5a-b58e56e181b0/ifvl_a_12336087_f0003.jpg)
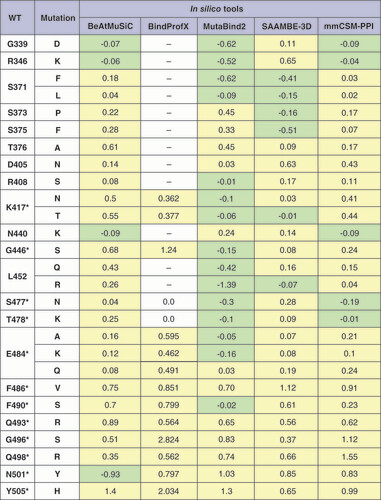
ΔΔGsingle calculation with BindProfX was performed only for interface mutations due to service limitations (fields for which calculations were not performed are marked with a dash). For mmCSM-PPI, all ΔΔGsingle values are written with the opposite sign to match them with other tools. Stabilizing mutations are marked in light green, and destabilizing mutations in light yellow.
*Mutations in the interface of the RBD–ACE2 complex.
WT: Wild-type.
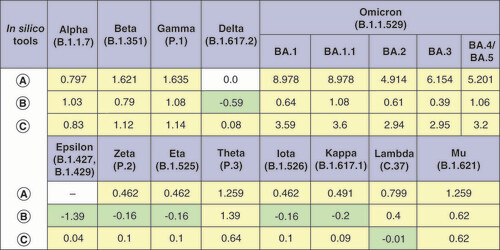
In silico tools used for ΔΔGmultiple calculations are labeled as follows: (A) BindProfX, (B) MutaBind2 and (C) mmCSM-PPI. Only interface mutations were taken into account when calculating ΔΔGmultiple with BindProfX due to service limitations (field for which calculation was not performed is marked with a dash). For mmCSM-PPI, all ΔΔGmultiple values are written with the opposite sign to match them with other tools. Stabilizing mutations are marked in light green, and destabilizing mutations in light yellow.
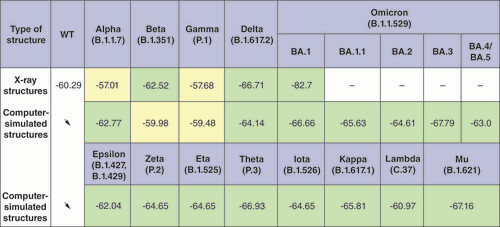
The arrows indicate that all computer-simulated structures were built based on the x-ray WT structure. SARS-CoV-2 variants that have more stable RBD–ACE2 complexes compared with WT are marked in light green, and variants that have less stable complexes are marked in light yellow. X-ray structures were not considered for the Omicron lineages BA.1.1, BA.2, BA.3, BA.4/BA.5; the corresponding fields are marked with a dash.
WT: Wild-type.
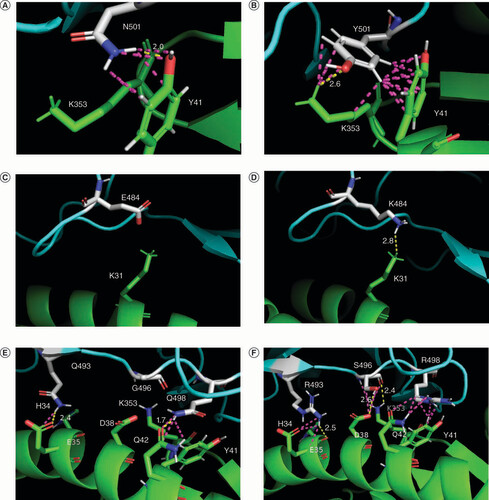
(A & B) Mutation N501Y: Y501 in Alpha variant (B) in comparison with N501 in the WT (A) forms additional contacts with ACE2 K353. (C & D) Mutation E484K: K484 in Beta, Gamma, Eta, Zeta, Theta, Iota and Mu variants creates a new H-bond with ACE2 K31, absent in the RBD–ACE2 complex of the WT. (E & F) Mutations Q493R, G496S, Q498R: Omicron (sublineage BA.1) mutations (F) in comparison with the WT (E) determine the rearrangement of interface contacts in the RBD–ACE2 complex; S496 forms new favorable H-bonds with ACE2 D38 and K353.
ACE2 is shown in green; RBD is shown in cyan; SARS-CoV-2 amino acids involved in mutations are shown in white. H-bonds are shown in yellow; other interchain contacts with a distance of fewer than 3.0 Å (ångström) are shown in light mangenta. The distances (Å) between the atoms are indicated only for H-bonds.
Characteristic mutation sets are indicated for five variants of concern (Alpha, Beta, Gamma, Delta and Omicron [BA.1 sublineage]). The red arrow indicates the ACE2 binding affinity of VOCs compared with the WT (based on the ΔG calculated values). The blue arrow indicates the gradation of immune escape ability (based on [Citation16] data).
WT: Wild-type.
![Figure 8. Mutational profiles of the SARS-CoV-2 variants.Characteristic mutation sets are indicated for five variants of concern (Alpha, Beta, Gamma, Delta and Omicron [BA.1 sublineage]). The red arrow indicates the ACE2 binding affinity of VOCs compared with the WT (based on the ΔG calculated values). The blue arrow indicates the gradation of immune escape ability (based on [Citation16] data).WT: Wild-type.](/cms/asset/381da350-ec2c-47e6-8cbb-f5f49a8fa97b/ifvl_a_12336087_f0008.jpg)