Figures & data
The figure shows an entire inflated microballoon catheter (A) and the inflated balloon (B).
Reproduced with permission from Terumo Europe NV, Leuven, Belgium.
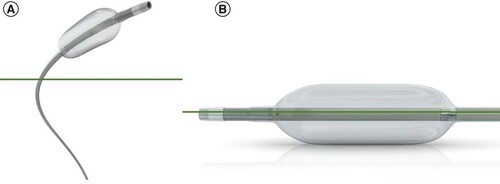
Table 1. Baseline and transarterial chemoembolization characteristics.
Available responses are shown in the right side of the image.
B-DEM-TACE: Balloon-occluded transarterial chemoembolization using drug-eluting microspheres; LT: Liver transplantation; SIRT: Selective internal radiation therapy.
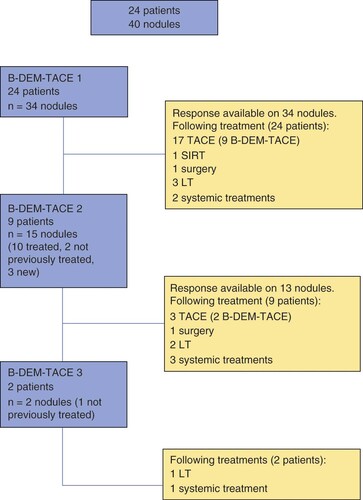
Table 2. Early and late laboratory toxicities (grade 1 according to Common Terminology Criteria of Adverse Events version 5).
Table 3. Evolution of biological parameters at different time points after the balloon-occluded transarterial chemoembolization using drug-eluting microspheres 1 (mean ± standard deviation, variables with normal distribution).
Table 4. Modified response evaluation criteria in solid tumors-best overall response.
Table 5. Modified response evaluation criteria in solid tumors-response on 1-month follow-up per nodule.
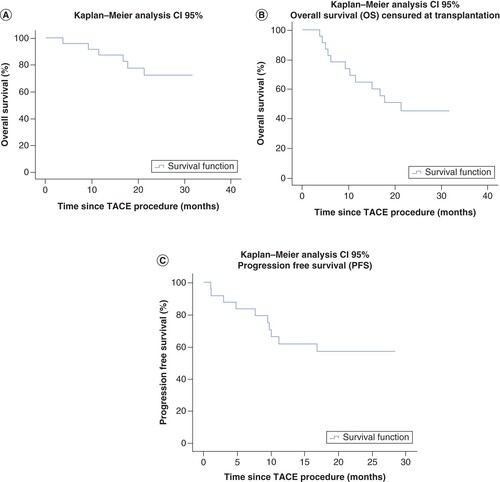
Kaplan–Meier estimates of overall survival (A), transplantation-free survival (B) and progression-free-survival (C).