Figures & data
Table 1. Patient demographics of the studied cohorts.
(A) Plasma levels of formation of collagen Type VI (PRO-C6, endotrophin); (B) plasma levels of degradation fragments of collagen Type VI (C6M); (C) alpha-fetoprotein (AFP) levels; (D) PRO-C6 levels in HCC patients divided into AFP negative (AFP<20) or AFP positive (AFP≥20). Statistical difference was calculated using a Mann–Whitney t-test. Statistical differences were analyzed using a Kruskal–Wallis test adjusted for Dunn’s multiple comparisons test. Data are presented as Tukey boxplots. Significance levels: *p < 0.05; **p = <0.01; ***p < 0.001; ****p < 0.0001.
AFP: Alphafeto-protein; HCC: Hepatocellular carcinoma.
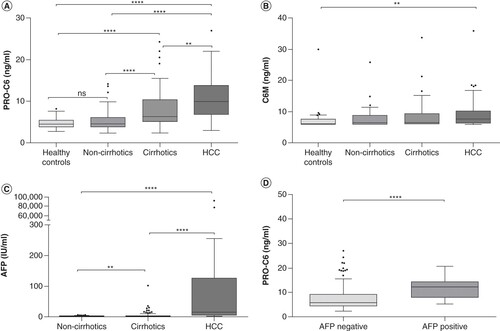
Table 2. Discriminative performance of PRO-C6 and AFP biomarkers for the diagnosis of hepatocellular carcinoma in cirrhotic patients.
The median is used as cut-off (low vs high) for PRO-C6 (low n = 42; high n = 41) and C6M (low n = 21; high n = 24), and 20 IU/ml cut-off for AFP (negative n = 49/positive n = 37). (A, C & E) represents relation to overall survival and (B, D & F) represents relation to progression-free survival. Significance levels: ns = nonsignificant, *p < 0.05; ***p < 0.001; ****p < 0.0001.
AFP: Alphafeto-protein.
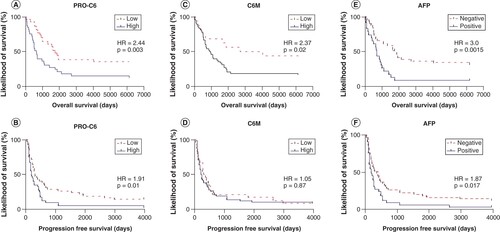
Table 3. Association between biomarker levels, clinical covariates and outcome for hepatocellular carcinoma patients.
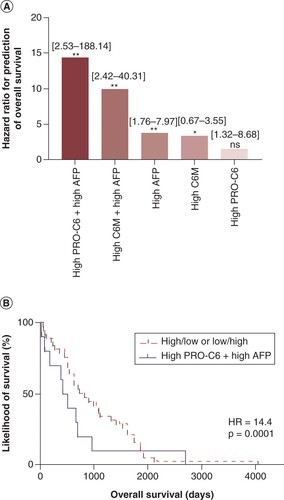
(A) Hazard ratio for the prediction of overall survival by each indicated multivariate model, all corrected for sex, age, BMI, Child-Pugh and number of lesions. High PRO-C6 (Q4) and high C6M (Q4); high AFP (≥20 IU/ml) (HRs from ). (B) Kaplan–Meier curves for the multivariate analysis of overall survival for high PRO-C6 (Q4) + high AFP (≥20 IU/ml). The 95% CI is seen for each group in brackets. Significance levels: ns = nonsignificant, *p < 0.05; ***p < 0.001; ****p < 0.0001.
AFP: Alpha-fetoprotein; HR: Hazard ratio.