
Figures & data
Table 1. The clinical characteristics of patients with NSCLC.
Figure 1. Comparison of plasma cfDNA concentration in NSCLC patients and healthy controls.
(A) The concentration of LINE1-97 bp fragment was significantly higher in NSCLC patients with stage I/II and stage III/IV than that of healthy controls. (B) The concentration of LINE1-97 bp fragment was significantly higher in NSCLC patients with stage I/IV than that of healthy controls. (C & D) Receiver operating characteristic curves for distinguishing NSCLC patients from healthy controls.
AUC: Area under the curve.
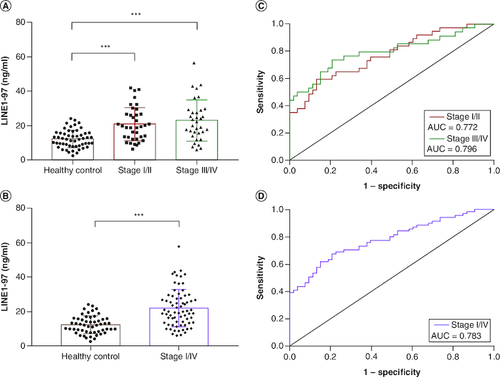
Figure 2. Comparison of plasma cfDNA concentration in NSCLC patients and healthy controls.
(A) The concentration of LINE1-266 bp fragment was significantly higher in NSCLC patients with stage I/II than that of healthy controls. (B) The concentration of LINE1-266 bp fragment was significantly higher in NSCLC patients with stage I/IV than in healthy controls. (C & D) Receiver operating characteristic curves for distinguishing NSCLC patients from healthy controls.
AUC: Area under the curve.
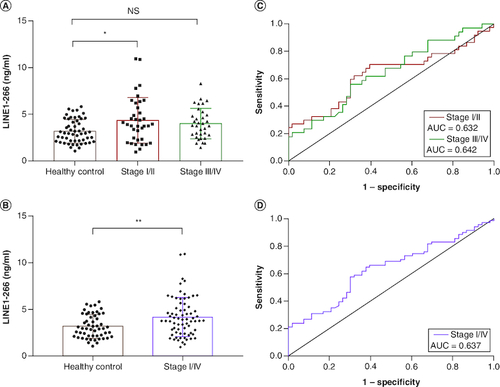
Table 2. Comparison of plasma cfDNA concentration, integrity between NSCLC patients and healthy controls.
Table 3. Diagnostic value of plasma cfDNA concentration and integrity in non-small-cell lung cancer patients.
Figure 3. Comparison of plasma cfDNA integrity in NSCLC patients and healthy controls.
(A) The plasma cfDNA integrity LINE1-266/97 was significantly lower in NSCLC patients with stage I/II and stage III/IV than in healthy controls. (B) The integrity of LINE1-266/97 was significantly lower in NSCLC patients with stage I/IV than in healthy controls. (C & D) Receiver operating characteristic curves for distinguishing NSCLC patients from healthy controls.
AUC: Area under the curve.
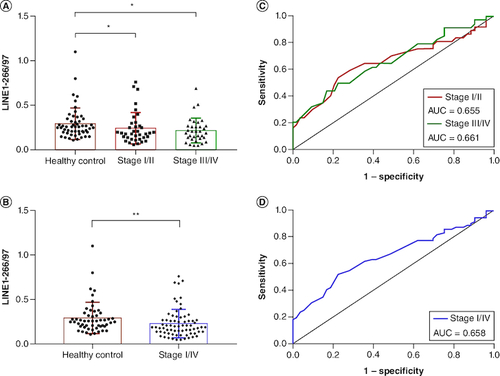
Figure 4. Correlation between plasma cfDNA and lymph node metastasis in NSCLC patients.
(A–C) There was no significant difference in plasma cfDNA concentration and integrity between lymph node metastasis (LNM)-positive and LNM-negative patients. (D–F) Receiver operating characteristic curves for distinguishing LNM-positive patients from LNM-negative patients.
AUC: Area under the curve.
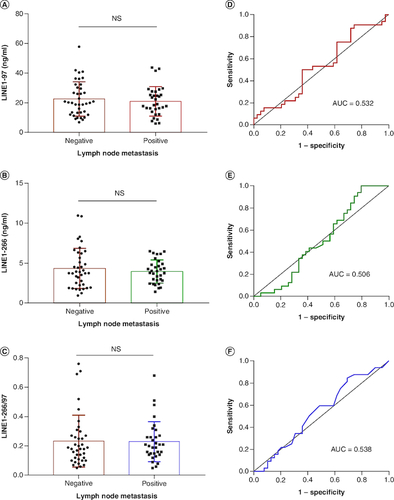
Figure 5. Diagnostic values of combined plasma cfDNA concentration and integrity in NSCLC patients.
(A) ROC curves of LINE1-97, LINE1-266 and LINE1-266/97 for distinguishing NSCLC patients with stage I/II from healthy controls. (B) ROC curves of the combination of plasma cfDNA concentration (LINE1-97, LINE1-266) and integrity (LINE1-266/97) for distinguishing NSCLC patients with stage I/II from healthy controls.
AUC: Area under the curve.
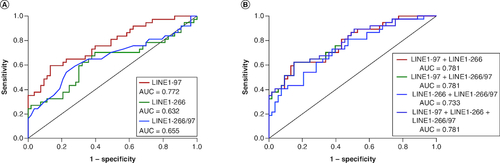
Table 4. Diagnostic value of combined plasma cfDNA concentration and integrity for NSCLC patients.