
Figures & data
Figure 1. Change in maximum tumor size by chest CT scans.
(A) CT image at the time of initial diagnosis. (B) Image after second line treatment. (C) Image after fourth line treatment. (D) Image after fifth line treatment. (E) Image after sixth line treatment. (F) Image after eighth line treatment. (G) Image during ninth line treatment.
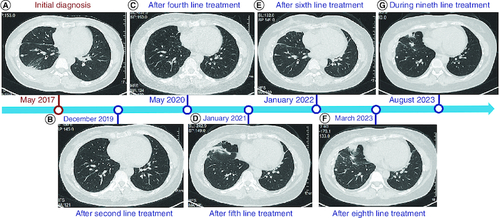
Figure 2. HE and immunohistochemistry staining of tumor.
HE: hematoxylin-eosin; TTF-1: thyroid transcription factor-1. All images were shown at 400×.
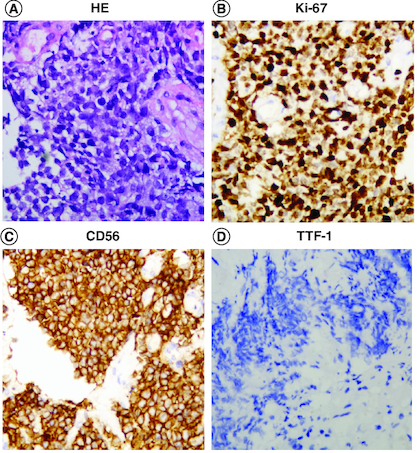
Figure 3. Treatment timeline.
The efficacy evaluation was judged according to the Response Evaluation Criteria in Solid Tumours (RECIST) (Version 1.1).
EP: etoposide plus cisplatin; IP: irinotecan plus cisplatin; PR: partial response; PD: progressive disease; SD: stable disease.
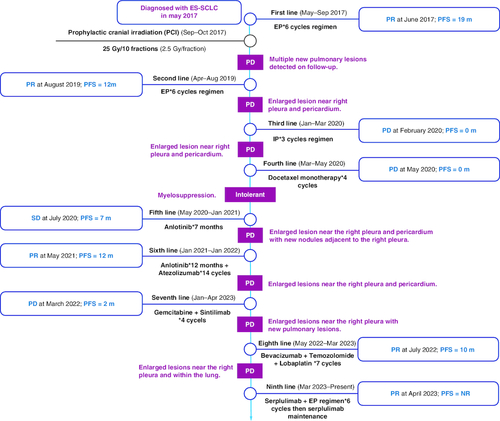
Figure 4. Dynamic changes in peripheral blood lymphocyte subpopulations during the treatment.
Data were acquired using flow cytometry. CD19 represents B cells, CD16+CD56 represents natural killer cells, CD45 represents common leukocyte antigen, CD8 represents cytotoxic T cells, CD4 represents helper T cells, and CD3 represents total T cells. The y-axis represents the number of cells/ml of blood.
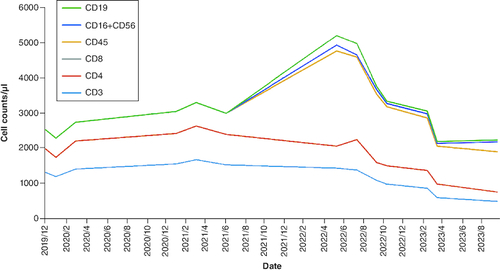
Table 1. The anti-cancer treatments of this patient.