
Figures & data
Table 1. Presents the sociodemographic and clinic characteristics.
Table 2. The relationship between inflammatory indices and other variables.
Figure 1. Progression-free survival relationship of age and inflammatory parameters, Kaplan-Meier graphics.
(A) Age, (B) NLR, (C) SII and (D) lymphocyte. NLR: Neutrophil–lymphocyte ratio; PFS: Progression-free survival; SII: Systemic immune inflammation index.
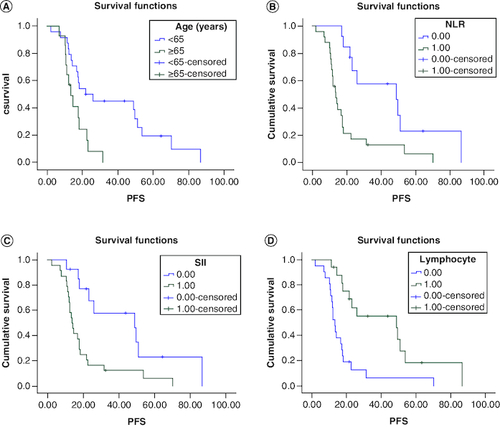
Figure 2. Overall survival relationship of age and inflammatory parameters, Kaplan-Meier graphics.
(A) Age, (B) NLR, (C) SII and (D) lymphocyte. NLR: Neutrophil–lymphocyte ratio; OS: Overall survival; SII: Systemic immune inflammation index.
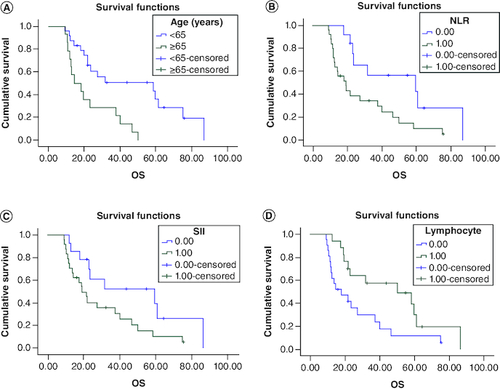
Table 3. Progression-free survival and overall survival relationships with categorical data.