Figures & data
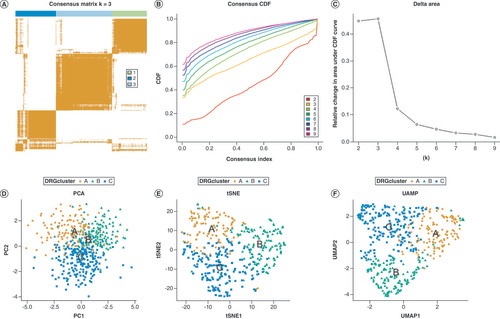
(A) The heatmap of the consensus matrix delineates three clusters (k = 3) and their corresponding correlation region. (B) a CDF curve of K = 2–10. (C) The relative change in area under the CDF curve of K = 2–10. (D–F) PCA, tSNE, and UMAP identified three DRG clusters.
CDF: Cumulative distribution function; PCA: Principal component analysis; tSNE: t-distributed stochastic neighbor embedding; UMAP: Uniform manifold approximation and projection.
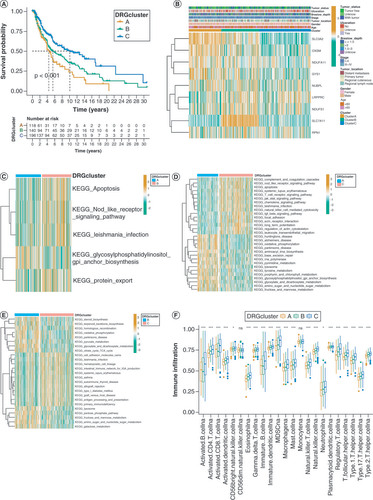
(A) Survival analysis was conducted on three DRG clusters. (B) Expression profiles of DRGs and clinicopathological characteristics between clusters. (C–E) The heat map of GSVA revealed the variations in pathways among the three clusters. (F) Abundances of infiltrating immune cells between three clusters.
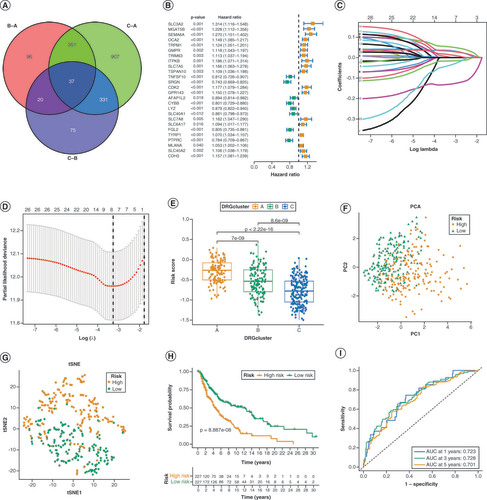
(A) The Venn diagram displays the overlap of differentially expressed DRGs. (B) The Univariate Cox regression analysis of 26 genes is represented in the forest plot. (C, D) The prognostic genes were analyzed using LASSO-Cox regression and the partial likelihood deviance. (E) The distribution of patients in the three DRG clusters and two DRG-score groups. (F, G) Principal Component Analysis (PCA) and t-distributed stochastic neighbor embedding (tSNE) reveal a clear distinction in transcriptomes among the two subcategories. (H) Analysis of overall survival (OS) in TCGA cohort using Kaplan-Meier method. (I) Receiver Operating Characteristic curves for predicting overall survival at 1 year, 3 years, and 5 years.
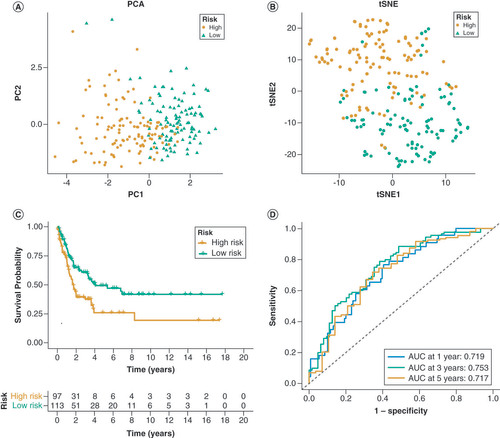
(A, B) Principal component analysis (PCA) and t-distributed stochastic neighbor embedding (tSNE) plot of the GSE65904 set. (C) Analysis of overall survival (OS) in GSE65904 set using the Kaplan-Meier method. (D) Receiver Operating Characteristic curves for predicting overall survival at 1 year, 3 years, and 5 years.
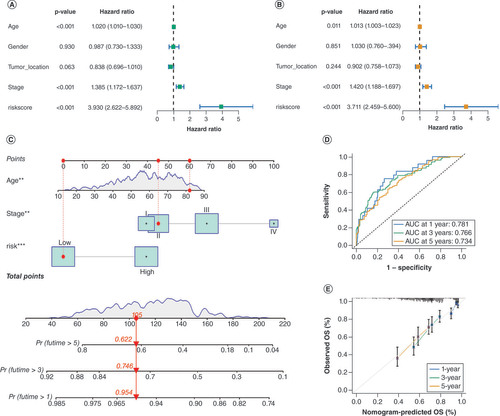
(A & B) Univariate and multivariate Cox regression analysis was conducted to validate the independence of the DRG-score as a prognostic predictor. (C) A nomogram utilizing the DRG-score, along with age, tumor stage. (D) Time-based receiver operating characteristic (ROC) curves of the nomogram for the prediction of 1-, 3-, and 5-year OS. (E) Calibration plots are used for internally validating the nomogram.
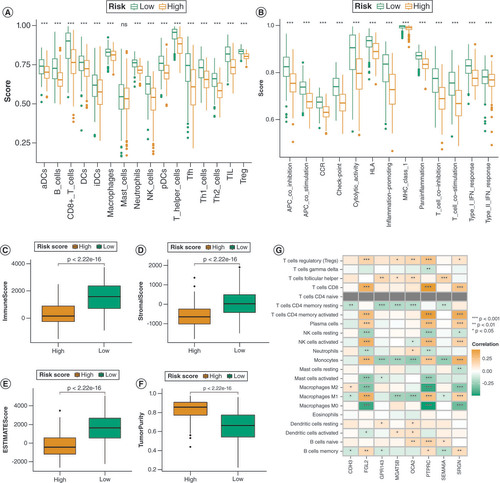
(A & B) Comparison of the enrichment levels of immune-related cells and pathways in the low- and high-risk groups. (C–F) A box plot illustrates the variances in the TME score when comparing the two DRG-score groups. (G) The relationship between the model genes and immune-related cells.
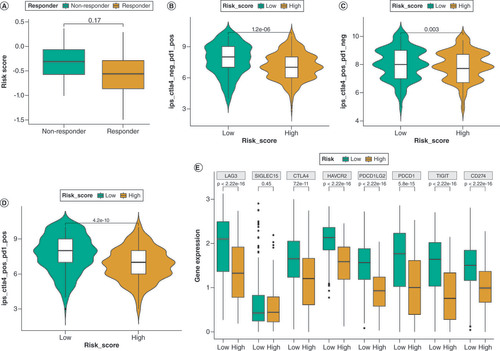
(A) Comparison of the tumor immune dysfunction and exclusion (TIDE) in the two DRG-score groups. (B–D) Comparison of the immunophenoscore (IPS) in the two DRG-score groups, categorized by anti-PD-1, anti-CTLA-4, or anti-(CTLA-4 plus PD-1). (E) Comparison of immune checkpoint gene expression in the two DRG-score groups.
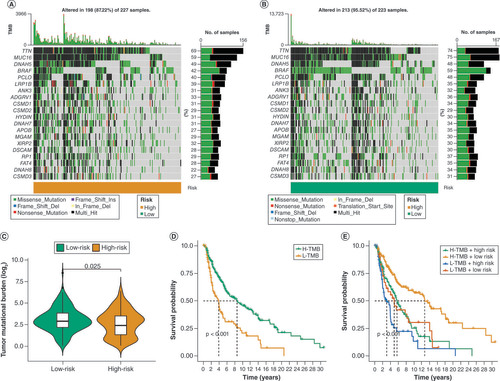
(A & B) Waterfall diagram illustrating the somatic mutation of tumors in both the high-risk and low-risk groups. (C) The tumor mutational burdenvaries among the subgroups with different DRG score. (D) Survival analysis was conducted on the various groups, categorized based on tumor mutational burden. (E) Analyzing the survival of different groups categorized by both tumor mutational burden and DRG score.
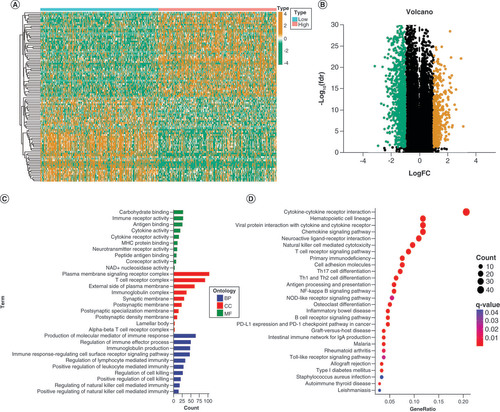
(A & B) The heatmap and Volcano plot of differentially expressed genes (DEGs). (C) The analysis of GO enrichment for BP, CC, and MF terms revealed the potential role of the DEGs. (D) The possible pathways were identified through Kyoto Encyclopedia of Genes and Genomes (KEGG) pathway enrichment analysis.