Figures & data
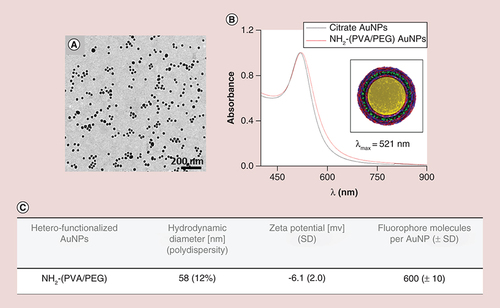
(A) Transmission electron microscopy image of 15 nm AuNPs core. (B) UV-visible spectra of the citrate and ATTO590 NH2-(polyvinyl alcohol/PEG) AuNPs. Inset: Schematic design of the heterofunctionalized AuNPs. (C) Physico-chemical characteristics of the AuNPs.
NP: Nanoparticle; SD: Standard deviation.
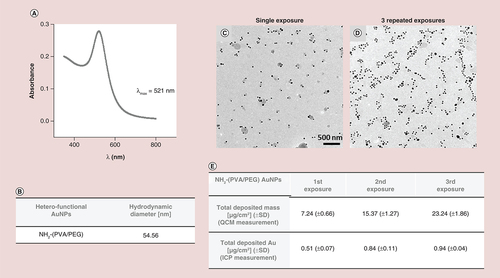
(A) UV-visible spectra of the aerosolized ATTO590 NH2-(polyvinyl alcohol/PEG)AuNPs using air–liquid interface cell exposure system system. (B) Hydrodynamic diameter of the aerosolized AuNPs. (C) Transmission electron microscopy images of deposited AuNPs following single or (D) three repeated aerosolization (scale bar for both images: 500 nm). Total deposition (mass per surface area) of aerosolized AuNPs upon single or repeated administration as measured by the quartz crystal microbalance and the inductively coupled plasma spectroscopy.
ICP: Inductively coupled plasma; NP: Nanoparticle; QCM: Quartz crystal microbalance.
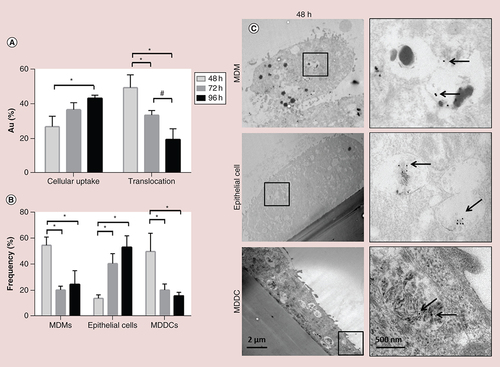
(A) Percentage of Au in the cellular and translocated fraction as measured by the inductively coupled plasma atomic emission spectroscopy (ICP-OES). (B) Au nanoparticle association within the different cell types of the in vitro model (flow cytometry analysis). (C) Transmission electron microscopy images show the presence of internalized Au nanoparticles at the different cell types of the co-culture model, following single aerosol exposure (48 h). Black arrows point out the position of the particles.
*p < 0.05.
MDDC: Monocyte-derived dendritic cell; MDM: Monocyte-derived macrophage.
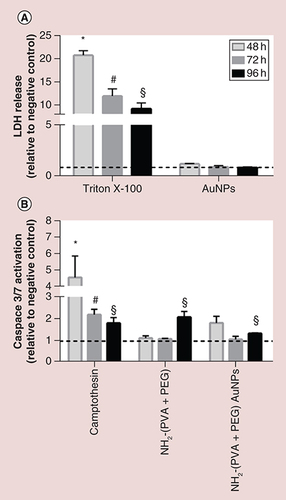
(A) LDH release and (B) activation of caspase 3 and 7 in the human model of the alveolar epithelial tissue barrier, following repeated exposure to functionalized Au nanoparticles for up to 96 h. Dashed lines (- - - ) represent the level of the negative control. Values were considered significant compared with the negative control when p < 0.05 (* for 48 h, # for 72 h and § for the 96 h time point). Co-cultures exposed apically to Triton X-100 (0.2%) and camptothecin (2 μm) were used as positive controls for the cytotoxicity and apoptosis determination, respectively.
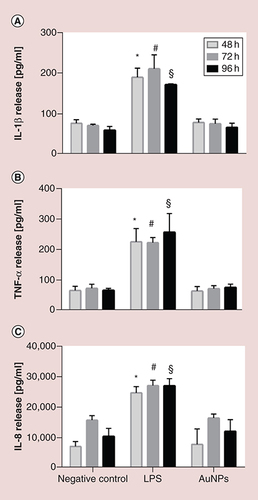
(A) IL-1β, (B) TNF-α and (C) IL-8 secretion after short-term repeated exposures NH2-(polyvinyl alcohol/PEG) Au nanoparticles. Values were considered significant compared with the negative control when p < 0.05 (* for 48 h, # for 72 h and § for the 96-h time point). Lipopolysaccharide (1 μg/ml) was added to the cultures for 24 h as a positive control for proinflammatory responses.