
Figures & data
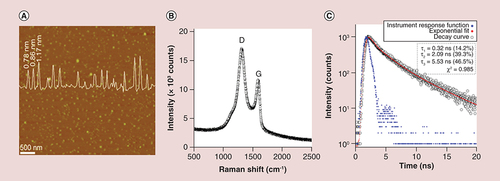
(A) Representative atomic force microscopy image of GQDs deposited on mica substrate indicating size around 20–40 nm, with a particle diameter spectrum showing the complete size distribution of the GQDs (overlaid). (B) Raman spectrum demonstrating peaks for D (defect) and G (graphene) at around 1354 and 1592 cm-1, respectively. (C) time-resolved photoluminescence spectrum of the prepared GQDs, demonstrating the emission lifetime (460 nm) following GQD excitation (360 nm) at room temperature.
GQD: Graphene quantum dot.
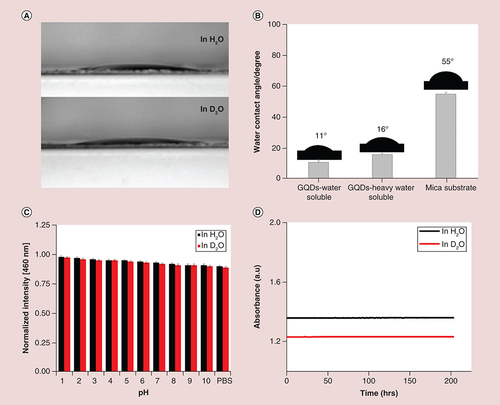
(A & B) Representative images and quantification of wettability in H2O and D2O, as measured by water contact angle, and in comparison with mica substrate; ‘mica substrate’ is the control without GQD. A digital camera was used to record the images and their contact angles were calculated by PolyPro software package. (C) pH-stability of GQDs in H2O and D2O indicating that no obvious luminescence quenching of the corresponding photoluminescence peak (460 nm) was observed in various buffered solutions (shown as mean ± SD from four different experiments) and (D) Photostability of GQDs in H2O and D2O over a period of 200 h.
GQD: Graphene quantum dot.
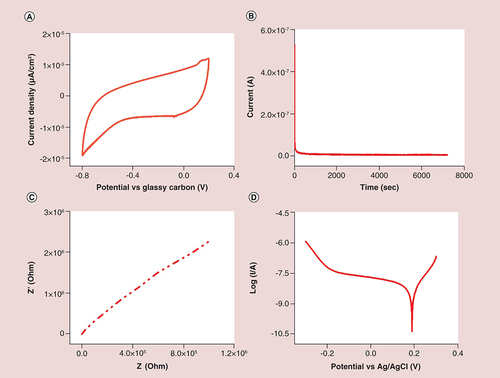
(A) Cyclic voltammetry curves showing the cycle stability at scan rate of 50 mV.s-1; (B) stability test performed from 0.2 V to -1.0 V; (C) electrochemical impedance spectroscopy (Nyquist plot) of graphene quantum dots. Frequency range: 100 kHz–0.1 Hz, voltage amplitude: 0.005 V; (D) Potentiodynamic polarization curve.
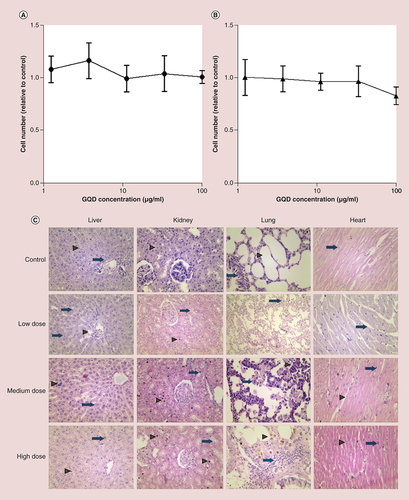
(A) Effect of GQDs on human bronchial epithelial cell (16HBE14o-) viability after 48 h incubation, relative to untreated control cells. (B) Effect of GQDs on murine fibroblast (NIH3T3) viability after 48 h incubation, relative to untreated control cells. Data were analyzed by one-way analysis of variance with a Tukey multiple comparisons test; no significant differences were observed. (C) Histological evaluation of the vital organs of rats at 4 weeks after intravenous injection of GQDs. Tissues of low, medium and high dose of GQD-treated rats were similar to those of the control group. In the control livers, hepatocytes were arranged in cord-like pattern (arrowhead). In this section, the hepatic triad is marked as arrow. Following low-dose GQDs, Kupffer cells were evident (arrow). At medium-dose GQD, some apoptotic bodies were evident (arrowhead) and occasional binuclear hepatocytes were also seen (arrow). At the high dose of GQDs, no infiltration of polymorphic inflammatory cells was seen; Kupffer cells were still evident (arrowhead) and some apoptotic bodies were clearly seen (arrow). In the kidney, renal corpuscles are shown, with healthy renal epithelium indicated by an arrowhead. While in low-, medium- and high-dose-treated tissues, cytoplasmic vacuolation were seen in renal tubular epithelial cell (arrow) but there was no evidence of inflammatory cells in renal parenchyma. In the control lung, normal alveoli (arrowhead) and bronchioles (arrow) are shown in untreated lung tissue. Some interstitial inflammatory infiltration was seen after low-dose GQD (arrow), while giant histiocytes were present in medium-dose-treated lung parenchyma (arrow). Pigmented alveolar macrophages were present in high-dose GQD lung tissue (arrowhead). In control and low-dose heart tissue, myofibers were in a normal arrangement with healthy nuclei (arrow). There was some brown pigmentation present in the parenchyma (arrow) following medium-dose GQDs. Healthy nuclei were seen in myofibers (arrowhead) and also some brown pigmentation (arrow) following administration of high-dose GQD. Representative images shown (n = 8 rats per group), ×200 original magnification.
GQD: Graphene quantum dot.
(A) Schematic diagram of singlet oxygen generation through energy transfer with an excited photosensitizer. (B) Time-dependent electron paramagnetic resonance signals of GQD solutions mixed with 4-hydroxy-2,2,6,6-tetramethylpiperidine. Signal intensity increased with increasing irradiation time (λmax = 365 nm). (C) Electron paramagnetic resonance spectra following irradiation of GQDs (in H2O and D2O) in the presence of 4-hydroxy-2,2,6,6-tetramethylpiperidine. Addition of the 1O2 quencher, L-histidine completely attenuated the signal. (D) Electron paramagnetic resonance spectra of GQDs in DEPMPO. No signals were observed in the dark, but clear signals were observed following irradiation (λmax = 365 nm) indicating generation of •OH and O2•-. Addition of the transition metal chelator DTPA to remove •OH radicals had little effect on the spectrum, indicating that O2•- was the dominant species.
DTPA: Pentetic acid; GQD: Graphene quantum dot.
(A): Adapted with permission from [Citation9].
![Figure 5. Singlet oxygen and reactive oxygen species generation by graphene quantum dots. (A) Schematic diagram of singlet oxygen generation through energy transfer with an excited photosensitizer. (B) Time-dependent electron paramagnetic resonance signals of GQD solutions mixed with 4-hydroxy-2,2,6,6-tetramethylpiperidine. Signal intensity increased with increasing irradiation time (λmax = 365 nm). (C) Electron paramagnetic resonance spectra following irradiation of GQDs (in H2O and D2O) in the presence of 4-hydroxy-2,2,6,6-tetramethylpiperidine. Addition of the 1O2 quencher, L-histidine completely attenuated the signal. (D) Electron paramagnetic resonance spectra of GQDs in DEPMPO. No signals were observed in the dark, but clear signals were observed following irradiation (λmax = 365 nm) indicating generation of •OH and O2•-. Addition of the transition metal chelator DTPA to remove •OH radicals had little effect on the spectrum, indicating that O2•- was the dominant species.DTPA: Pentetic acid; GQD: Graphene quantum dot. (A): Adapted with permission from [Citation9].](/cms/asset/13cab0e4-1991-4b12-853b-fc6e9b4340da/innm_a_12341303_f0005.jpg)