Figures & data
FS: Fluorescein sodium; NP: Nanoparticle; PEI: Polyethyleneimine.
(A) 1H NMR spectrum, (B) Fourier transform infrared spectrum and (C) differential thermal/thermogravimetric analysis of fluorescein sodium (FS) (1), polyethyleneimine (PEI) (2), PEI–NH2–FS nanoparticles (3) and PEI–NHAc–FS nanoparticles (4), respectively.
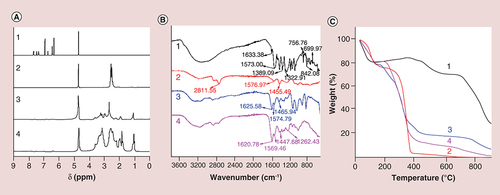
Table 1. Mean particle size and zeta potential of PEI–NHAc–FS.
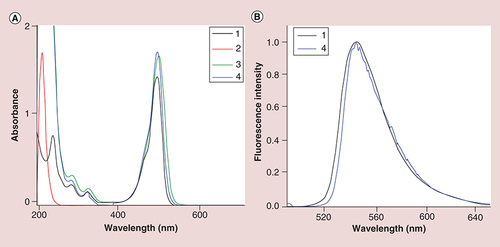
UV-Vis spectrum (A) and excitation-emission matrix fluorescence spectrum (B) of fluorescein sodium (FS) (1), polyethyleneimine (PEI) (2), PEI–NH2–FS NPs (3) and PEI–NHAc–FS NPs (4), respectively.
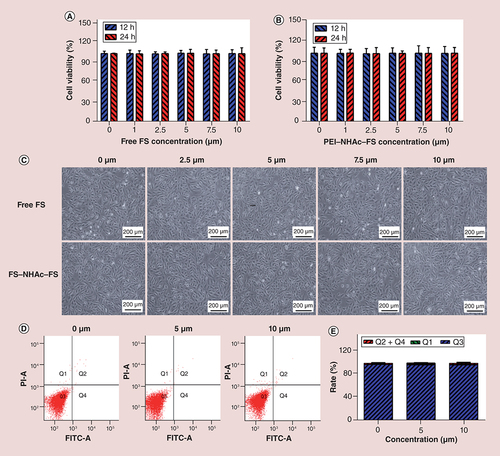
(A) CCK-8 assay of ARPE-19 cells treated with FS and (B) PEI–NHAc–FS nanoparticles at different FS concentrations for 12 and 24 h. (C) Morphological images of ARPE-19 cells treated with 0, 2.5, 5, 7.5, 10 μM FS and PEI–NHAc–FS nanoparticles for 24 h. (Scale bar: 200 μm). (D) Cell apoptosis was detected by Annexin V/PI staining. (E) Statistical analysis of cells rate (%).
FITC: Fluorescein isothiocyanate; FS: Fluorescein sodium; PEI: Polyethyleneimine; PI: Propidium Iodide.
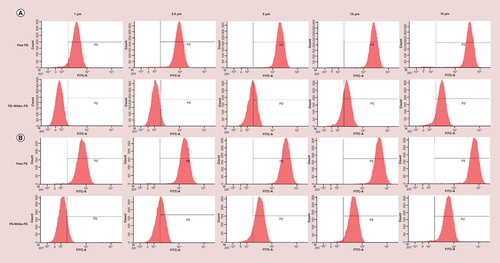
Fluorescence intensity was detected by flow cytometry with a 488-nm Argon-ion laser for the incubation of ARPE-19 cells with free FS and polyethyleneimine–NHAc–FS nanoparticles for (A) 12 h or (B) 24 h at different FS concentration. Statistical analysis of FITC-A mean in varying concentrations of FS and PEI–NHAc–FS in ARPE-19 cells for (C) 12 h and (D) 24 h. Fluorescence images were recorded for the incubation of ARPE-19 cells with free FS and polyethyleneimine–NHAc–FS nanoparticles at different FS concentration for (E) 12 h and (F) 24 h. Scale bar: 200 μm.
FITC: Fluorescein isothiocyanate; FS: Fluorescein sodium.
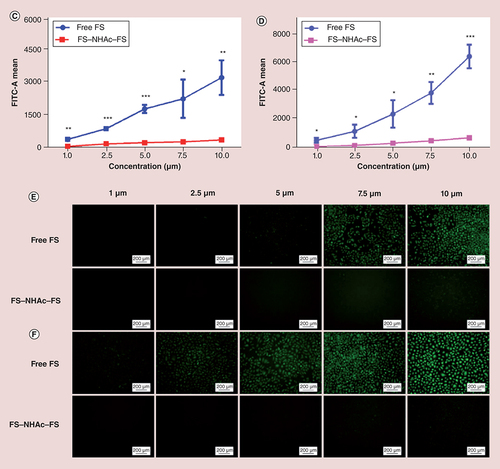
Scale bar: 10 μm.
FS: Fluorescein sodium.
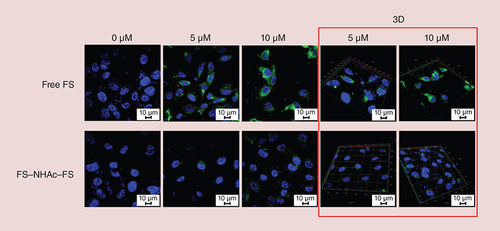
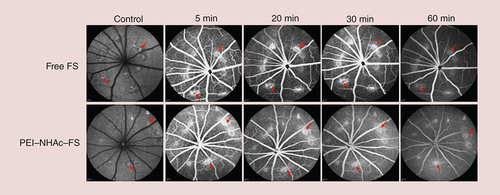
Fundus angiography images by at autofluorescence mode and different time points postintravenous injection of free FS or PEI–NHAc–FS nanoparticles at different FS concentration ([A] 0.5%, [B] 1% and [C] 5%).
FS: Fluorescein sodium; PEI: Polyethyleneimine.
![Figure 7. In vivo fluorescence imaging of different agents was detected by fundus angiography.Fundus angiography images by at autofluorescence mode and different time points postintravenous injection of free FS or PEI–NHAc–FS nanoparticles at different FS concentration ([A] 0.5%, [B] 1% and [C] 5%).FS: Fluorescein sodium; PEI: Polyethyleneimine.](/cms/asset/fee25ec2-0f5b-469d-8986-bfde713494f4/innm_a_12341533_f0008.jpg)
FS: Fluorescein sodium; PEI: Polyethyleneimine.
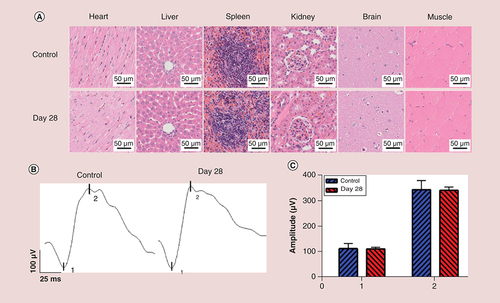
(A) Histomorphological images of heart, liver, spleen, kidney, brain and muscle after intravenous injection of polyethyleneimine–NHAc–fluorescein sodium nanoparticles (1% fluorescein sodium concentration) after 28 days. Scale bar: 50 μm. (B) The retinal function was measured postintravenous injection of polyethyleneimine–NHAc–fluorescein sodium nanoparticles (1% fluorescein sodium concentration) via electroretinogram. (C) Statistical analysis of the mean amplitudes of the 1 (a-wave) and 2 (b-wave).