Figures & data
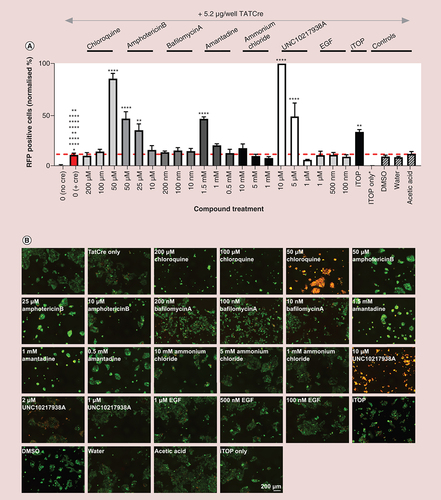
(A) 5000 HEK293 Cre reporter cells were plated per well of a 384-well plate. Assuming a 24-h doubling time, 24 h later 10,000 cells were treated with or without 5.2 μg/well TATCre in the absence or presence of compounds that modify the uptake or escape of delivered cargoes. Cells were imaged for RFP fluorescence (a positive readout of Cre recombination) using IncuCyte® S3. The percentage of RFP positive cells from the total GFP positive cell population, normalized to a maximum of 100% is shown in the graph; n = 4. Error bars ± standard error of mean. Normally distributed data was analyzed using one way analysis of variance. Data, which were not normally distributed, were excluded from analysis of variance analysis and analyzed using a nonparametric unpaired t-test. Red line indicates baseline value for TATCre treatment of cells in the absence of uptake or endosomal escape enhancing compound. (B) Representative images associated with each treatment condition. Images exported from IncuCyte® S3 2018 software and arranged using Inkscape. Scale bar 200 μm; n = 4.
Significance is indicated by colour coded asterisks that match statistically significant test conditions to the appropriate control. Asterisks in figure represent level of significance: *p ≤ 0.05, **p ≤ 0.01, ***p ≤ 0.001 and ****p ≤ 0.0001.
DMSO: Dimethyl sulfoxide; RFP: Red fluorescent protein.
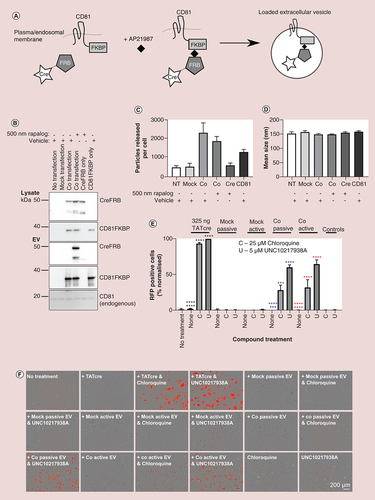
(A) Diagram showing the rapalog-induced dimerization process. CreFRB dimerizes with EV marker CD81FKBP in the presence of rapalog AP21967. This means that CreFRB is in the vicinity of EV biogenesis and should be incorporated into EVs that are produced. (B) Representative western blots showing CreFRB and CD81FKBP expression in EV producing cell lysates and in the EVs isolated from transfected cells in the presence of 500 nM rapalog or vehicle control. Cotransfection condition = both CreFRB and CD81FKBP were expressed in the cells otherwise cells were nontransfected, mock transfected or transfected individually with CreFRB or CD81FKBP. Total 40 μg/well of lysate or equal volumes of EVs (corrected to cell number) were loaded onto the gel; n = 3. Details of antibodies used can be found in Supplementary Table 1. (C & D) Nanoparticle tracking analysis was used to analyze the average number of particles released by each cell (C) and the size of EVs (D) n = 3. Error bars ± standard error of mean. (E) In a 384-well plate approximately 10,000 HEK293 Cre reporter cells were treated with either 325 ng TATCre or 20 μg/ml (1 μg/well) EVs isolated from mock transfected cells and from cells coexpressing both CreFRB and CD81FKBP (co) in the presence of ethanol vehicle control (passively loaded) or 31 nM rapalog AP21967 (actively loaded). After 24 h, the effect that 25 μM chloroquine and 5 μM UNC10217938A had upon functional delivery of EV associated CreFRB was assessed. The normalized percentage of RFP positive cells from the total GFP population is shown; n = 3. Error bars ± standard error of mean. One way analysis of variance. (F) Images showing the RFP expression (positive readout for Cre recombination) for each condition as described in (E). Scale bar 200 μm. Images taken by IncuCyte® S3; n = 3.
Significance is indicated by colour coded asterisks that match statistically significant test conditions to the appropriate control. Asterisks in figure represent level of significance: *p ≤ 0.05, **p ≤ 0.01, ***p ≤ 0.001 and ****p ≤ 0.0001.
C: 25 μM Chloroquine; EV: Extracellular vesicle; NT: No treatment; RFP: Red fluorescent protein; U: 5 μM UNC10217938A.
(A) EVs were isolated from CD81FKBP and CreFRB expressing cells in the presence of ethanol vehicle control (passively loaded) and or 31 nM AP21967 (actively loaded). EV preparation volume was corrected for cell number, and 7.5 μl of each EV preparation was loaded onto gels for western blotting of EV markers (CD81, ALIX and TSG101), ubiquitous marker GAPDH, non-EV marker (calnexin) and overexpressed CreFRB and CD81FKBP. One representative blot of n = 3 experiments is shown. (B) Cryo electron microscopy images show the morphology and integrity of EVs preparations. Scale bar 100 nm; n = 3. (C) Total 10 μg EVs were treated with 0.0008%/3 μM trypsin +/- 0.1% Triton X-100, or left untreated. Resultant EVs were analyzed by western blot for CreFRB, CD81FKBP and other EV markers (TSG101 and ALIX), ubiquitous marker GAPDH and contaminant marker calnexin; n = 3. (D) HEK293 Cre reporter cells were plated into a six-well plate and 24 h later media was refreshed to media containing 20 μg/ml EVs that were either passively loaded or actively loaded with CreFRB in the presence and absence of 25 μM chloroquine and 5 μM UNC10217938A. After a 24 h incubation, cells were lysed and equal volumes of lysate from each condition western blotted for the presence of CreFRB protein; n = 3. (E) Approximately 10,000 HEK293 Cre reporter cells/well were treated with decreasing concentrations of CreFRB actively loaded EVs from 1 μg/well – 0 (average of 19.22 ng – 0 CreFRB/well as calculated in ), passively loaded EV from 1 μg/well – 0 (5.63 ng – 0 CreFRB/well as calculated in ) and TATCre (20–0 ng/well). The efficiency of functional delivery, in the presence and absence of endosomal escape enhancing compounds 25 μM chloroquine and 5 μM UNC10217938A, was analyzed by quantifying percentage of RFP positive cells 24 h after treatment started. From this data, the EC50 for each EV condition was calculated using GraphPad Prism; n = 3. Error bars ± standard error of mean.
EV: Extracellular vesicle.
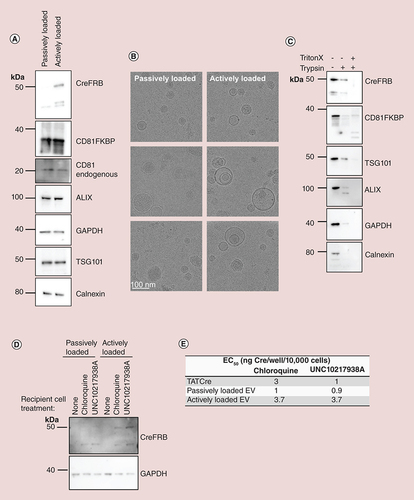
Table 1. Calculation of CreFRB extracellular vesicle content.
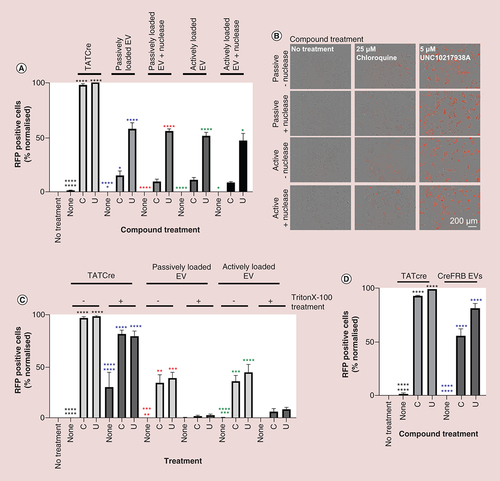
(A) 20 μg EVs were treated with the nuclease Basemuncher (1:10,000) in phosphate-buffered solution supplemented with 2 mM MgCl2. Excess nuclease was removed by pelleting the EVs by ultracentrifugation at 100,000 g. Recipient HEK293 Cre reporter cells were then treated with 20 μg/ml (1 μg/well) EVs with or without 25 μM chloroquine or 5 μM UNC10217938A. The percentage of GFP expressing cells that also expressed RFP normalized to a maximum of 100% was then calculated from the images acquired by IncuCyte® S3 after 24-h treatment; n = 3, error bars ± standard error of mean. One way analysis of variance was used for normally distributed data. Data, which were not normally distributed, were excluded from analysis of variance analysis and analysed using a nonparametric unpaired t-test. (B) Representative images for (A) after 24 h EV treatment. (C) TATCre and passively/actively loaded EVs were treated with or without 0.1% Triton X-100 for 30 min at room temperature before 325 ng TATCre/well and 20 μg/ml EV (1 μg/well) were added to HEK293 Cre reporter cells with or without 25 μM chloroquine and 5 μM UNC10217938A. The efficiency of CreFRB delivery was quantified by analyzing the percentage of RFP positive cells 24 h after treatment; n = 3, error bars ± standard error of mean. (D) EVs were isolated from Expi293F™ cells overexpressing CreFRB only. HEK293 Cre reporter cells were treated with 20 μg/ml (1 μg/well) EVs or 325 ng TATCre, and functional delivery was assessed by quantifying the percentage of cells expressing RFP normalized to 100% after a 24-h treatment; n = 3, error bars ± standard error of mean. One-way analysis of variance.
Significance is indicated by colour coded asterisks that match statistically significant test conditions to the appropriate control. Asterisks in figure represent level of significance: *p ≤ 0.05, **p ≤ 0.01, ***p ≤ 0.001 and ****p ≤ 0.0001.
C: 25 μM Chloroquine; EV: Extracellular vesicle; RFP: Red fluorescent protein; U: 5 μM UNC10217938A.